Every hiring process is a leaky bucket. You pour resources into a Branded Job Posting, watch the Applicant Pool fill up, and then… silence. Somewhere between the initial interest and the final offer, candidates vanish. Most organizations know how many people they hired, but few can pinpoint exactly where they lost the ones who got away.
This is where measuring the Application Completion Rate and subsequent stage conversions becomes critical. It isn’t just about the final “win”; it’s about mapping the Candidate Journey to find where the friction lies. If you notice a high Abandonment Rate following an Asynchronous Interview, is the assessment too long, or is the technology creating a barrier? Identifying these bottlenecks is the only way to protect your Candidate Experience.
Instead of guessing why your Candidate Pipeline is stalled, these platforms provide real-time benchmarks and flag equity gaps. When you measure every transition, you stop losing great talent to invisible process gaps and start building a more resilient, predictable, and fair hiring engine.
The primary headline metric is the End-to-End Funnel Conversion Rate (EFCR): the proportion of all candidates who enter the top of the funnel who ultimately result in a hire.
EFCR (%) = (Total Hires ÷ Total Candidates Entering Funnel) × 100
Industry benchmarks for EFCR range from 0.5% to 3% for most professional roles receiving significant application volume, reflecting the reality that hiring processes are necessarily selective. But the EFCR headline figure obscures the stage-level dynamics that actually determine whether the funnel is well-designed or poorly calibrated. Stage-level conversion rates are where the diagnostic work happens.
What is Conversion Rate in Recruiting?
Recruiting conversion rate is a stage-specific measurement of funnel progression efficiency, tracking the percentage of candidates who advance from one hiring stage to the next across the full sequence from initial awareness or application through to accepted offer.
The most common stage-level conversion rates tracked in a professional hiring funnel are:
- Application-to-Screen Rate: The proportion of applicants who advance from initial application to a recruiter phone screen or initial qualification step.
- Screen-to-Interview Rate: The proportion of candidates who pass the initial screen and advance to a hiring manager or panel interview.
- Interview-to-Assessment Rate: In processes that include structured assessments, the proportion of interviewed candidates who advance to that stage.
- Assessment-to-Offer Rate: The proportion of candidates completing assessments who receive a formal offer.
- Offer-to-Acceptance Rate: The proportion of formal offers that are accepted by candidates.
Each of these rates tells a different story about a different part of the process. A high application-to-screen rate with a low screen-to-interview rate suggests the application process is attracting broadly but the screen is filtering aggressively or inefficiently. A high offer-to-acceptance rate suggests strong employer brand, competitive compensation, and a positive candidate experience through the late funnel. A low offer-to-acceptance rate suggests the opposite on one or more of those dimensions.
Are You Running a Hiring Funnel or Just Hoping Candidates Stay?
Most organizations track their offer acceptance rate. Fewer track their application-to-screen rate. Almost none track the full stage-by-stage conversion sequence with the discipline that would reveal where the funnel is losing the most value.
This is a significant gap, because the conversion rate pattern across the full funnel is where the most actionable diagnostic information lives. A process that looks productive at the surface level, receiving 200 applications per role, screening 40, interviewing 12, and making 2 offers, is producing a specific conversion profile: 20% application-to-screen, 30% screen-to-interview, 17% interview-to-offer. Whether those rates represent a well-calibrated funnel or a poorly designed one depends entirely on whether the right candidates are being advanced at each stage and the wrong ones are being filtered, rather than the reverse.
The failure mode that conversion rate analysis most effectively surfaces is the expensive false positive: the organization that advances candidates confidently through three or four interview rounds and then makes offers that are declined at a high rate. The late-funnel candidate loss is the most expensive kind because it represents the full cost of all prior funnel stages, plus the time cost of the interviewing panel, plus the delay to the eventual hire. A 40% offer acceptance rate on senior roles, which is not uncommon for organizations with uncompetitive compensation or poor candidate experience, represents a compounding cost that stage-level conversion tracking makes visible in a way that aggregate time-to-fill figures simply do not.
Organizations that implement stage-level conversion rate tracking and act on the resulting insights report an average 31% improvement in offer acceptance rate, a 24% reduction in time-to-fill, and a 19% improvement in hiring manager satisfaction with candidate quality within two hiring cycles. The improvements come not from changing who is sourced but from identifying and removing the specific friction points and calibration failures that are causing the funnel to lose the right candidates at the wrong stages.
Here is a scenario that illustrates how this plays out in practice. A professional services firm is hiring senior consultants. Their EFCR is 0.8%, which feels low but is within normal range for competitive roles. The TA leader pulls stage-level conversion data for the first time and finds: 18% application-to-screen, 55% screen-to-interview, 72% interview-to-assessment, 48% assessment-to-offer, and 34% offer-to-acceptance.
The 34% offer acceptance rate is the anomaly that stands out immediately. Nearly two-thirds of candidates who make it through a full interview and assessment process are declining the offer. The firm investigates: exit surveys from declined candidates consistently cite compensation (below market for the experience level being targeted), a lack of clarity on growth trajectory provided during the interview process, and a long time elapsed between final interview and offer (average 18 days).
None of these were visible without stage-level conversion analysis. All three are actionable. The offer acceptance rate improvement that follows the interventions, faster offer timelines, compensation recalibration, and structured growth conversation integrated into the final interview, moves the acceptance rate from 34% to 61% within two hiring cycles. That single change reduces the number of searches required per eventual hire by more than 40%.
Your Resume Isn’t Getting Read
Let’s Get That Fixed!
75% of resumes get auto-rejected. avua’s AI Resume Builder optimizes formatting, keywords, and scoring in under 3 minutes, so you land in the “yes” pile.
The Full Recruiting Funnel: Stage-Level Conversion Rates
A complete recruiting funnel has more stages than most organizations track. The full sequence from awareness to retained hire typically includes seven to nine distinct transitions, each with its own conversion rate and its own set of influencing factors.
Stage 1: Awareness-to-Application
The proportion of candidates who encounter a job opportunity (through job boards, social sourcing, referrals, career page visits, or recruiter outreach) and proceed to submit an application. This rate is heavily influenced by employer brand strength, job posting quality, application process friction, and the perceived match between the candidate’s profile and the role requirements as presented.
Awareness-to-Application Rate = (Applications Submitted ÷ Total Opportunity Impressions) × 100
Industry benchmark: 2 to 8% for job board postings; 15 to 30% for targeted recruiter outreach to pre-qualified passive candidates.
Stage 2: Application-to-Screen
The proportion of submitted applications that advance to a recruiter screen or initial qualification call. This rate reflects the quality alignment between the applicant pool and the role requirements, and the screening criteria applied.
Application-to-Screen Rate = (Candidates Advanced to Screen ÷ Total Applications Received) × 100
Industry benchmark: 12 to 25% for roles with broad application volumes; 30 to 50% for targeted sourcing campaigns with pre-qualification.
Stage 3: Screen-to-Interview
The proportion of screened candidates who advance to a hiring manager or panel interview. This reflects both the quality of the initial screen (is it correctly identifying the right candidates?) and the alignment between recruiter and hiring manager assessments.
Screen-to-Interview Rate = (Candidates Advanced to Interview ÷ Candidates Screened) × 100
Industry benchmark: 30 to 55%.
Stage 4: Interview-to-Final Stage
The proportion of initial interview candidates who advance to a final interview, technical assessment, or other penultimate evaluation stage.
Industry benchmark: 20 to 40%.
Stage 5: Final Stage-to-Offer
The proportion of final-stage candidates who receive a formal offer.
Industry benchmark: 25 to 50%.
Stage 6: Offer-to-Acceptance
The proportion of formal offers that are accepted. This is the conversion rate most directly influenced by compensation competitiveness, candidate experience quality, and offer process speed.
Offer Acceptance Rate = (Offers Accepted ÷ Total Offers Extended) × 100
Industry benchmark: 65 to 85% for well-calibrated processes with competitive compensation; below 50% indicates a structural problem in compensation, candidate experience, or offer timing.
Stage 7: Acceptance-to-Start
The proportion of accepted offers that result in the candidate actually starting in the role (accounting for rescissions, counteroffers accepted post-acceptance, and personal circumstances changes between acceptance and start date).
Industry benchmark: 88 to 96%.
Conversion Rate vs. Related Metrics
| Metric | What It Measures | Stage Focus | Primary Use |
|---|---|---|---|
| Stage-Level Conversion Rate | Advancement rate between specific funnel stages | Any transition | Funnel diagnostic and optimization |
| End-to-End Conversion Rate (EFCR) | Total hires as proportion of total funnel entries | Full funnel | Overall funnel efficiency summary |
| Offer Acceptance Rate | Accepted offers as proportion of offers extended | Late funnel | Compensation and candidate experience signal |
| Sourcing Yield Rate | Hires as proportion of sourced candidates | Early funnel | Sourcing channel effectiveness |
| Application Completion Rate | Completed applications as proportion of started | Pre-application | Application process friction |
| Time-to-Fill | Days from requisition open to offer accepted | Full funnel | Speed efficiency (not quality) |
| Quality of Hire | Performance rating of hires at defined intervals | Post-hire | Funnel outcome quality |
The relationship between conversion rate and quality of hire is the most important in this table. A funnel with high conversion rates at every stage but poor quality of hire scores is advancing too many candidates through stages that should be filtering more effectively. A funnel with low conversion rates but strong quality of hire may be screening too aggressively, leaving good candidates behind. The optimal conversion profile is one that balances throughput efficiency with quality signal, advancing the right candidates at the right rate at each stage.
What the Experts Say?
Conversion rate data is the most underused asset in talent acquisition. Most teams know their offer acceptance rate and maybe their time-to-fill. Very few can tell you their screen-to-interview rate, or what it was three months ago, or how it compares across different sourcing channels. That gap is where most of the optimization opportunity lives.
– Hung Lee, Curator of Recruiting Brainfood
How to Measure and Interpret Conversion Rates?
The Core Formula Family
Each stage conversion rate follows the same structure:
Stage Conversion Rate = (Candidates Advancing from Stage N ÷ Candidates Entering Stage N) × 100
The compounding effect of stage conversion rates is critical to understand. Small improvements at each stage compound dramatically across the full funnel. Consider a funnel with 1,000 applications targeting 6 hires:
| Stage | Entering | Conversion Rate | Advancing |
|---|---|---|---|
| Application | 1,000 | 18% | 180 |
| Screen | 180 | 40% | 72 |
| Interview | 72 | 33% | 24 |
| Final Stage | 24 | 50% | 12 |
| Offer | 12 | 50% | 6 |
| Acceptance | 6 | 100% | 6 Hires |
Now apply a 5-percentage-point improvement at just two stages, application-to-screen (18% to 23%) and offer acceptance (50% to 65%):
| Stage | Entering | Conversion Rate | Advancing |
|---|---|---|---|
| Application | 1,000 | 23% | 230 |
| Screen | 230 | 40% | 92 |
| Interview | 92 | 33% | 30 |
| Final Stage | 30 | 50% | 15 |
| Offer | 15 | 65% | 9.75 (10) |
| Acceptance | 10 | 100% | 10 Hires |
The same application volume now produces 10 hires instead of 6, a 67% improvement in funnel output from two targeted 5-point conversion improvements. This compounding effect is why even modest conversion rate improvements at bottleneck stages produce significant hiring output gains.
Benchmarks by Stage and Role Type (2026 Data)
| Funnel Stage | Tech Roles | Finance/Professional | Healthcare Clinical | Sales |
|---|---|---|---|---|
| Application-to-Screen | 14% | 19% | 22% | 26% |
| Screen-to-Interview | 38% | 44% | 41% | 48% |
| Interview-to-Final | 31% | 35% | 38% | 42% |
| Final-to-Offer | 41% | 46% | 44% | 52% |
| Offer Acceptance | 71% | 74% | 79% | 68% |
| EFCR | 0.6% | 1.1% | 1.4% | 2.2% |
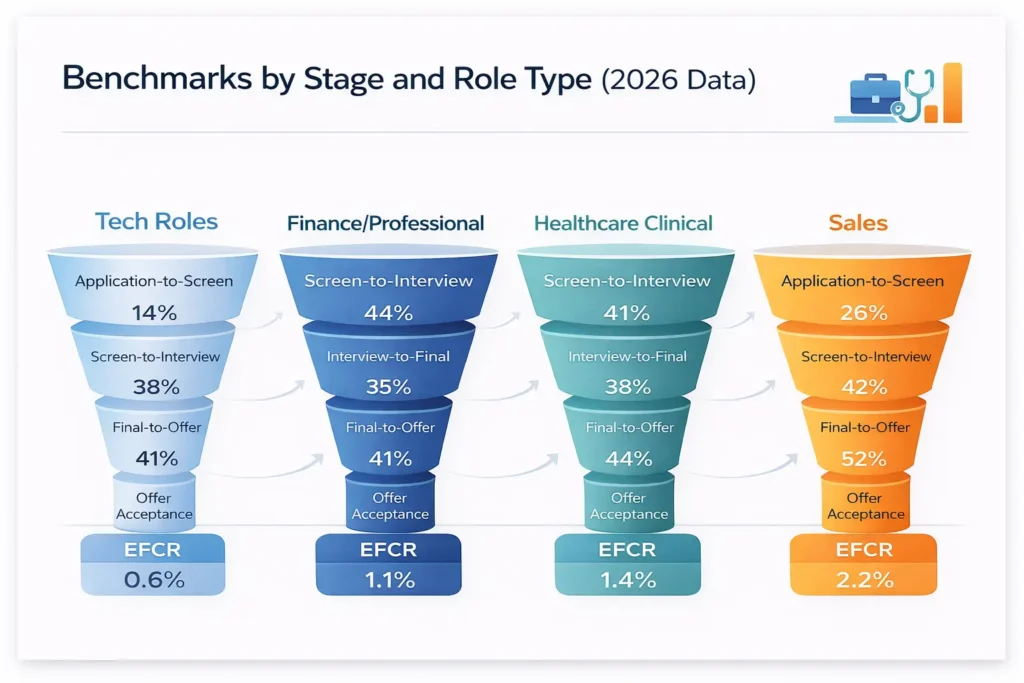
Tech roles show the lowest application-to-screen rate (14%), reflecting a highly competitive market where applicant pools contain a high proportion of candidates with mismatched qualifications relative to the specificity of technical requirements. Sales roles show the highest EFCR (2.2%), reflecting broader candidate pool accessibility and higher offer volume relative to search depth.
Key Strategies for Optimizing Recruiting Conversion Rates
How AI Is Transforming Recruiting Conversion Rate Analysis?
Real-Time Stage-Level Tracking
AI-powered ATS platforms now track conversion rates in real time across every funnel stage, producing live dashboards that show current funnel health rather than retrospective reports. This enables recruiters and TA leaders to identify conversion rate drops at specific stages as they happen, rather than discovering them in quarterly reporting cycles after the damage is done.
Predictive Conversion Scoring
Machine learning models trained on historical funnel data can now predict the probability that a specific candidate will convert at each subsequent stage given their profile and the current funnel context. This predictive scoring helps recruiters prioritize their engagement effort toward candidates with the highest expected conversion probability, improving funnel throughput without increasing headcount.
Channel Attribution
AI attribution modeling identifies the specific combination of sourcing channels and candidate touchpoints that produce the highest conversion rates across the full funnel, not just the first touchpoint. This multi-touch attribution gives TA leaders a more accurate picture of which channels are genuinely driving hiring output and which are generating volume that does not convert.
Candidate Drop-Off Detection
AI systems that monitor candidate engagement signals (email opens, application progress, response times, assessment completion) can identify candidates who are showing early signs of disengaging from the process before they formally withdraw. This allows recruiters to intervene proactively, with targeted communication or process acceleration, before candidate dropout becomes conversion loss.
Stop Juggling
10 Job Boards.
Search One
Your next role is already here. avua pulls opportunities from across the web into a single searchable feed; filtered by role, location, salary, and remote preference.
1.5 Million+
Active Jobs
380+
Job Categories
Conversion Rate Analysis and Diversity, Equity, and Inclusion
Conversion rate data is one of the most powerful tools available for identifying systemic inequity in the hiring process, because it makes disparate impact visible in quantitative terms that are hard to dismiss.
Adverse Impact Analysis by Stage
When conversion rates are tracked by demographic group at each funnel stage, patterns of disparate impact become visible. If candidates from underrepresented groups convert from application to screen at a significantly lower rate than candidates from majority groups with equivalent qualifications, this is an empirical signal that the screening process may be applying criteria that are not strictly job-relevant or that the AI screening tools in use have trained biases that disadvantage specific populations.
Disparate impact analysis at each stage, comparing conversion rates across demographic cohorts and investigating the causes of significant gaps, is both an ethical obligation for equitable hiring and an increasingly important legal compliance consideration in jurisdictions where AI-assisted hiring tools are subject to bias audit requirements.
Offer Acceptance Rate Disparities
Organizations sometimes find that their offer acceptance rates differ significantly across demographic groups, particularly for candidates from underrepresented backgrounds. This pattern typically reflects compensation inequity (offers to candidates from underrepresented groups that are lower than comparable offers to majority-group candidates), candidate experience differences (less attentive or communicative recruiter engagement), or a perception that the organization’s culture is not genuinely inclusive. Tracking offer acceptance rate by demographic group surfaces this signal in a way that general diversity reporting metrics typically do not.
Pipeline Diversity Tracking
Tracking the demographic composition of the candidate pool at each funnel stage reveals at which point pipeline diversity is being lost. If diverse candidates enter the top of the funnel at acceptable rates but are lost at disproportionate rates at specific stages, those stages represent intervention points for process redesign, recruiter training, or criteria recalibration. This stage-specific diversity tracking is a more actionable framework than aggregate diversity reporting because it locates the problem rather than just describing the outcome.
Common Challenges and Solutions
| Challenge | Solution |
|---|---|
| ATS Does Not Track Stage-Level Conversion | Define and tag funnel stages consistently in the ATS; use recruiting analytics overlays if native tracking is inadequate |
| Conversion Rate Varies Wildly Across Roles | Segment benchmarks by role family and seniority level; avoid comparing a software engineering funnel to a sales associate funnel |
| Cannot Distinguish Withdrawals from Rejections | Add a disposition reason field to every stage transition; make withdrawal tracking as systematic as rejection tracking |
| Conversion Improvements Reduce Quality | Add quality-of-hire metrics to every conversion optimization initiative; validate conversion rate improvements against post-hire performance |
| Low Offer Acceptance Rate But No Clear Cause | Run candidate exit surveys for declined candidates; track time from final interview to offer; benchmark compensation against current market data |
Real-World Case Studies
Case Study 1: The Software Company
A software company was experiencing a 19-week average time-to-fill for software engineering roles despite receiving an average of 280 applications per role. Stage-level conversion analysis revealed the bottleneck: a technical assessment stage with a 14% pass rate that was filtering out candidates who were subsequently identified by the assessment vendor as likely qualified for the role. The assessment had been designed for a more senior role profile and was being applied to mid-level roles without recalibration.
Recalibrating the assessment to the mid-level role profile and adding a human review step for borderline assessment scores improved the assessment-to-offer rate from 14% to 29%. The application volume required per hire dropped from 280 to approximately 160. Time-to-fill improved from 19 weeks to 11 weeks, from a single bottleneck identification and intervention.
Case Study 2: The Retail Organization
A large retail organization was running high-volume hiring for store management roles and tracking only two metrics: total applications and total hires. When they implemented stage-level conversion tracking for the first time, they found that their offer acceptance rate was 44%: they were making 2.3 offers for every eventual hire, at a processing cost of approximately $1,800 per offer made. The primary reason for declined offers, from exit survey analysis, was the time elapsed between final interview and offer: an average of 22 days, during which candidates were routinely receiving and accepting competing offers.
They implemented a process change: hiring managers were required to communicate a hire/no-hire decision within 48 hours of the final interview, and HR was required to issue formal offers within 72 hours of that decision. The offer-to-acceptance rate improved from 44% to 71% within the first hiring cycle. The cost savings from the reduced number of offers required per hire paid for the process change infrastructure investment within two months.
Case Study 3: The Financial Services Firm
A financial services firm tracking conversion rates by sourcing channel discovered that their employee referral program was producing a screen-to-interview conversion rate of 61%, compared to 31% for job board applications and 44% for recruiter-sourced candidates. Despite this performance differential, only 8% of their total hires were sourced through employee referrals, while 64% came from job boards.
They restructured their sourcing investment: increased referral program incentives, made the referral submission process simpler, and actively promoted the program internally with channel-specific conversion data as the business case. Within six months, employee referrals had grown from 8% to 23% of total hires. The quality-adjusted cost per hire for the overall program decreased by $3,200 per hire as the highest-converting, lowest-cost-per-hire channel grew as a proportion of total sourcing volume.
Building a Recruiting Conversion Rate Dashboard: What to Track?
Conversion Rate Across the Talent Acquisition Lifecycle
Sourcing Strategy Design
Conversion rate data by channel should directly inform sourcing strategy. If the data shows that targeted recruiter outreach converts at three times the rate of inbound job board applications for a specific role family, the sourcing investment should reflect that differential rather than defaulting to equal spend across channels. Conversion rate is the ROI metric for sourcing investment.
Job Posting and Application Design
The awareness-to-application and application completion rates reflect the design quality of the candidate’s entry point to the funnel. Long, friction-heavy application processes, poorly written job descriptions, and career pages with inadequate employer brand content all produce lower conversion at the funnel’s earliest stages. These are the conversion rates most directly responsive to content and UX improvements.
Process Speed and Communication
Mid-funnel conversion rates, screen-to-interview and interview-to-offer, are significantly influenced by process speed and candidate communication quality. Candidates who experience long gaps between stages, or who receive inconsistent or delayed communication, withdraw at higher rates than those who experience a smooth, well-paced process. These conversion rates are where candidate experience investment produces the most measurable return.
Compensation and Offer Design
The offer acceptance rate is the conversion metric most directly controlled by compensation competitiveness, offer presentation quality, and the relationship built with the candidate through the late funnel. It is also the stage where the cumulative cost of the entire prior funnel is either harvested or lost, making it the highest-leverage conversion point for organizations that have strong early-funnel performance but poor late-funnel yield.
The Real Cost of Unconverted Candidates: By the Numbers
| Conversion Profile | Candidates Required per Hire | Cost per Hire (Process)Cost per Hire (Process) | Offers Required per Hire | Estimated Total Cost per Hire |
|---|---|---|---|---|
| Low Conversion (All Stages) | 480 | $6,200 | 3.1 | $9,400 |
| Average Conversion | 280 | $4,100 | 1.9 | $6,200 |
| Optimized Conversion (Key Stages) | 160 | $2,800 | 1.3 | $4,100 |
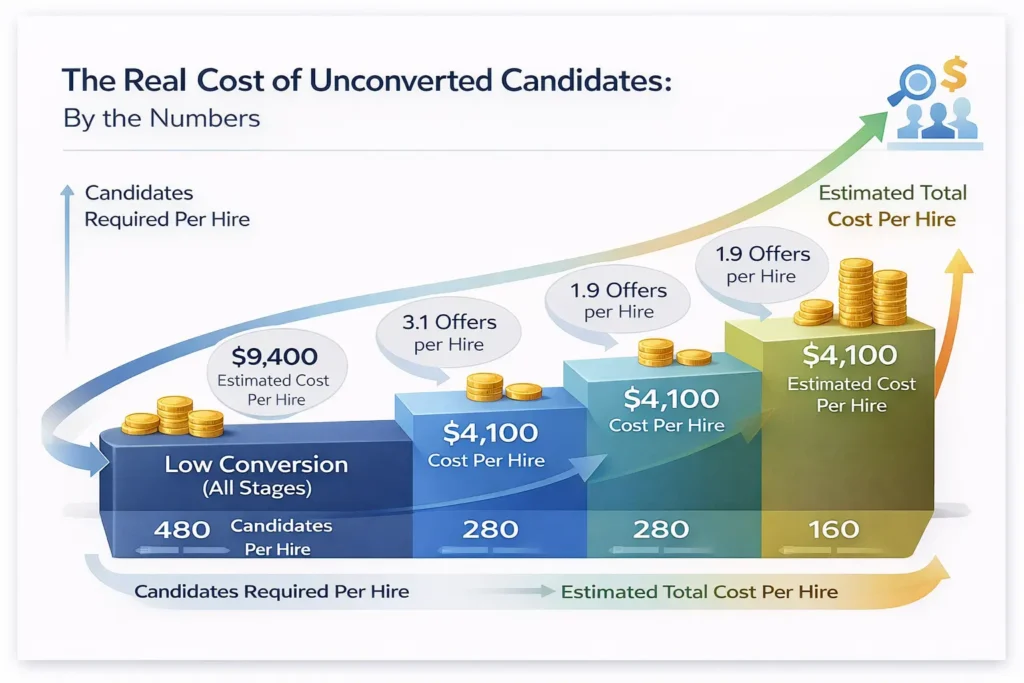
The cost model incorporates recruiter time per candidate evaluated, ATS and assessment tool costs per candidate processed, hiring manager interview time, and HR administrative cost per offer issued. The difference between low conversion and optimized conversion profiles represents a $5,300 per hire cost advantage that compounds significantly at scale: for an organization making 200 hires per year, optimized conversion rate management represents over $1 million in annual recoverable hiring cost.
Related Terms
| Term | Definition |
|---|---|
| Funnel | The sequential stages of the hiring process through which candidates progress from initial awareness to hire |
| Offer Acceptance Rate | The proportion of formal job offers that are accepted by candidates; the most commonly tracked late-funnel conversion metric |
| Sourcing Yield Rate | The proportion of sourced candidates who ultimately result in a hire; a channel-level conversion summary metric |
| Adverse Impact Analysis | Examination of whether hiring process conversion rates differ significantly across demographic groups in a way that disadvantages protected classes |
| Application Completion Rate | The proportion of candidates who begin an application process and complete it; a measure of application friction |
| Quality of Hire | Post-hire performance and retention metrics that validate whether high conversion rate is producing strong hiring outcomes |
Frequently Asked Questions
What is a good offer acceptance rate?
For most professional roles, an offer acceptance rate above 70% is considered healthy. Above 80% indicates strong employer brand, competitive compensation, and a positive candidate experience. Below 60% is a significant signal that something in the late funnel is causing candidates to disengage: compensation that is below market, a long gap between final interview and offer, or a candidate experience that has not built sufficient organizational affinity through the process. Rates below 50% represent a structural problem that requires investigation rather than incremental adjustment.
Should conversion rates be higher or lower for more competitive roles?
Not necessarily. For scarce roles with small total candidate markets, early-funnel conversion rates (application-to-screen, screen-to-interview) are often higher because the applicant pool is more pre-qualified and more targeted. Late-funnel conversion rates (offer acceptance) may be lower because candidates in scarce specializations have more competing offers. The benchmarks that matter are role-type specific, not universal.
How often should conversion rates be reviewed?
Stage-level conversion rates for active searches should be monitored weekly, or at minimum after each stage transition for individual roles, so bottlenecks can be identified and addressed within the active search timeline rather than in retrospect. Aggregate conversion rate reporting for program-level insights should be reviewed monthly and compared against 90-day and year-over-year trends. Demographic conversion rate analysis for equity compliance purposes should be reviewed quarterly at minimum.
Can improving conversion rates lead to lower quality hires?
Yes, if the conversion rate improvement is achieved by lowering assessment standards rather than by reducing process friction. The risk is highest at the screening stage: if application-to-screen rate is improved by relaxing qualification criteria rather than improving job posting targeting, the candidates advancing may be less qualified on average than those previously advancing. Every conversion rate improvement initiative should include a quality validation step: comparing the post-hire performance of the cohort hired under the new conversion profile against the prior cohort.
How does conversion rate analysis relate to time-to-fill?
They are related but measure different things. Time-to-fill measures how long the hiring process takes. Conversion rate measures how efficiently candidates progress through each stage. An organization can have a fast time-to-fill with poor conversion rates (by moving quickly through a poorly designed funnel that advances the wrong candidates) or a slow time-to-fill with good conversion rates (by running a rigorous process that produces strong outcomes but takes longer). Both metrics are needed for a complete picture of funnel performance.
Conclusion
Conversion rate in recruiting is not a single number. It is a diagnostic framework: a way of looking at the hiring process as a series of measurable transitions and asking, at each one, whether the right candidates are advancing and why the ones who are not are being lost.
Organizations that track only their end result, the hire, or only their most visible late-funnel metric, the offer acceptance rate, are operating with a partial picture of a process that has multiple points of leverage. The stage-level conversion data is where the optimization opportunity lives, and in most hiring functions, it is also where the most significant and most actionable insights are waiting to be found.
The funnel does not fix itself. But it does tell you what is wrong, if you know what to measure and where to look.