For years, recruiting was ruled by “gut feel” and pattern recognition. While experience matters, intuition alone can’t distinguish between a great match and a subconscious Bias in Hiring. It can’t tell you if your Active Sourcing is actually working or if your interview questions truly predict long-term performance.
Data-driven recruiting changes the game. By systematically analyzing the Candidate Journey, organizations can identify exactly where they are losing top talent, perhaps by tracking the Abandonment Rate at specific application stages. This methodology isn’t about replacing humans with machines; it’s about providing recruiters with the evidence needed to make better decisions. For instance, knowing which channel provides the highest-quality Applicant Pool allows for smarter, more defensive resource allocation.
In 2026, AI Hiring platforms and talent dashboards are no longer “nice-to-haves”, they are the baseline. The real winners aren’t just those with the most data, but those with the analytical capability to translate those metrics into a more efficient Candidate Pipeline. Moving from instinct to evidence doesn’t make the process less human; it makes it more effective, predictable, and fair.
The primary metric anchoring a data-driven recruiting function is the Recruiting Analytics Maturity Score (RAMS), a composite assessment across four dimensions:
RAMS = (Data Collection Completeness + Analytical Depth + Decision Integration + Outcome Validation) ÷ 4
Where each dimension is scored on a 1 to 5 scale. A RAMS above 4.0 indicates a genuinely mature data-driven function. Most organizations in 2026 score between 2.0 and 3.2, meaning they are collecting data but not yet consistently translating it into improved decisions.
What is Data-Driven Recruiting?
Data-driven recruiting is a talent acquisition approach in which structured data collection, metric tracking, and analytical frameworks are used to inform sourcing strategy, candidate assessment, process design, and hiring investment decisions, enabling talent acquisition teams to identify what is working, diagnose what is not, and make improvements grounded in evidence rather than assumption.
The methodology operates across three levels. At the operational level, it means tracking the metrics that describe how the current hiring process is functioning: conversion rates, time-to-fill by stage, cost per hire by channel, and offer acceptance rates. At the analytical level, it means examining relationships between those metrics to identify root causes of problems and opportunities for improvement. At the strategic level, it means connecting recruiting metrics to business outcomes: quality of hire, first-year retention, hiring manager satisfaction, and the downstream performance impact of talent acquisition decisions.
Most organizations operate at the operational level. The functions genuinely differentiated by data-driven recruiting are those operating at all three.
Is Your Recruiting Function Making Decisions or Making Assumptions?
There is a version of data-driven recruiting that most organizations believe they have and very few actually do. They have an ATS that generates reports. They track time-to-fill. They know their cost-per-hire. And when a hire goes wrong, they conduct a post-mortem that produces observations about the candidate’s background or the interview process, but rarely produces a change to the process itself.
This is not data-driven recruiting. It is data-adjacent recruiting: data is present, but it is not driving decisions. The distinction matters because an organization that believes it is data-driven but is not has lost the benefit of both approaches. It is not developing the experience-based intuition that comes from deep pattern recognition over time, and it is not developing the analytical rigor that comes from systematic data use. It has the compliance cost of data collection without the decision quality benefit of data analysis.
Genuinely data-driven recruiting functions share three characteristics that distinguish them from data-adjacent ones.
The first is that they have pre-defined the questions they are trying to answer with their data before they collect it. Not “what data do we have?” but “what do we need to know in order to improve this decision?” The data collection infrastructure follows from the questions, not the other way around.
The second is that they close the loop between recruiting metrics and post-hire outcomes. Time-to-fill and cost-per-hire are process metrics. Quality of hire, 12-month performance ratings, and first-year retention are outcome metrics. The function that tracks only process metrics knows how fast and how cheaply it is hiring. The function that connects process metrics to outcome metrics knows whether fast and cheap is producing good or bad outcomes, and can therefore make decisions about when to invest in slower, more thorough processes.
The third is that they make decisions differently because of the data. Not just in meetings where data is cited as post-hoc justification, but in actual sourcing strategy, assessment design, interview question selection, and offer timing. If data is being collected but decisions are being made the same way they were made before data was available, the function is not data-driven.
Organizations with mature data-driven recruiting functions report 24% lower time-to-fill, 18% lower cost-per-hire, and 31% higher quality of hire scores compared to those using primarily intuition-based processes. These are not marginal improvements. They reflect the compounding effect of making better decisions across hundreds of hiring choices annually.
The scenario that makes the transformation concrete: a financial services firm had been filling relationship manager roles with a consistent process for four years: LinkedIn sourcing plus two contingency agencies, three-round interview process, behavioral questions selected by each hiring manager, offer in the final week of the process. Time-to-fill averaged 51 days. First-year attrition was running at 27%.
A data-driven audit revealed four specific findings. LinkedIn sourcing was producing 34% of applicants but only 11% of hires; employee referrals were producing 19% of applicants and 38% of hires. The three behavioral questions that most strongly correlated with strong 12-month performance ratings were not the ones being asked consistently; two of the five most commonly used questions showed no correlation with performance outcomes.
The offer timing variable (days between final interview and offer) showed a strong negative correlation with offer acceptance rate: every additional day of delay was associated with a 4.2 percentage point reduction in acceptance probability. And first-year attrition was concentrated almost entirely in hires made through the two contingency agencies, not through direct sourcing channels.
Each of these findings translated into a specific decision: reallocate sourcing spend toward referral program investment, standardize the three high-validity interview questions across all hiring managers, implement a 48-hour offer target from final interview, and reduce agency reliance for this role type.
Eighteen months after implementation, time-to-fill for relationship manager roles was 34 days. First-year attrition was 14%. No process was added. Decisions were made differently because the data made better decisions visible.
Your Resume Isn’t Getting Read
Let’s Get That Fixed!
75% of resumes get auto-rejected. avua’s AI Resume Builder optimizes formatting, keywords, and scoring in under 3 minutes, so you land in the “yes” pile.
The Data-Driven Recruiting Framework: Four Layers
Layer 1: Operational Metrics (What Is Happening)
Operational metrics describe the current state of the hiring process. They are the foundation of data-driven recruiting and the starting point for any analytical work. Core operational metrics include:
- Sourcing Metrics: Application volume by channel, source of hire distribution, cost per application by channel, outreach response rates for active sourcing campaigns.
- Funnel Conversion Metrics: Stage-by-stage conversion rates (application to screen, screen to interview, interview to offer, offer to acceptance), candidate drop-out rates by stage, and time-in-stage averages.
- Efficiency Metrics: Time-to-fill by role type, cost per hire by channel and role type, recruiter productivity (hires per recruiter per quarter), and hiring manager time-per-hire.
- Candidate Experience Metrics: Candidate Net Promoter Score (cNPS), application completion rates, post-process survey scores.
Layer 2: Diagnostic Analytics (Why It Is Happening)
Diagnostic analytics examine relationships between operational metrics to identify root causes of performance gaps. This layer asks not just what the numbers are, but what is driving them.
Examples of diagnostic analytics in recruiting: comparing conversion rates by sourcing channel to identify which channels are producing the most qualified pipeline (not just the most volume); analyzing time-in-stage data to identify where the funnel is creating delays that drive candidate drop-out; examining inter-hiring-manager variance in screen-to-interview conversion rates to identify whether brief misalignment is producing inconsistent candidate quality; and correlating offer timing data with offer acceptance rates to quantify the impact of process speed on hiring competitiveness.
Layer 3: Predictive Analytics (What Will Happen)
Predictive analytics use historical patterns to forecast future outcomes. In recruiting, this includes: modeling which sourcing channels are likely to produce the best hires for a new role based on historical data from similar roles; predicting which candidates in the current pipeline are most likely to drop out before offer based on engagement pattern signals; forecasting time-to-fill for new requisitions based on role type, market conditions, and current pipeline depth; and identifying which interview question response patterns are most predictive of post-hire performance.
This layer requires more data history and more analytical sophistication than the first two, but it is where the highest-value decisions are made: not what happened or why, but what to do differently next time to get a better outcome.
Layer 4: Outcome Validation (Whether It Worked)
Outcome validation closes the loop between recruiting process decisions and post-hire outcomes. It requires connecting recruiting data to performance management data, and it is the layer most commonly missing in organizations that consider themselves data-driven.
Without outcome validation, a recruiting function can optimize its process metrics indefinitely without knowing whether those optimizations are producing better hires. With it, every sourcing investment, every assessment design choice, and every process change can be evaluated not just on its efficiency impact but on its quality impact. This is the layer that transforms recruiting analytics from a reporting function into a learning function.
Data-Driven Recruiting vs. Related Approaches
| Approach | Decision Basis | Data Use | Primary Strength | Primary Limitation |
|---|---|---|---|---|
| Data-Driven Recruiting | Evidence from systematic data analysis | Proactive; informs decisions | Improving decisions over time | Requires data infrastructure and analytical capability |
| Intuition-Based Recruiting | Experience and pattern recognition | Retrospective; post-hoc justification | Speed; contextual nuance | Not scalable; bias-amplifying; non-reproducible |
| Process-Driven Recruiting | Standardized procedures | Compliance-focused | Consistency and fairness | May not optimize for outcomes |
| Technology-Driven Recruiting | Automation and AI tools | Tool-mediated | Efficiency and scale | Tool outputs still require interpretation |
| Evidence-Based Recruiting | Research findings applied to practice | Borrowed from I/O psychology | Validity and defensibility | Research-to-practice translation gap |
The most important distinction in this table is between data-driven and intuition-based recruiting, because these two approaches are in direct tension in most organizations. Experienced recruiters and hiring managers have developed genuine expertise that is valuable. The goal of data-driven recruiting is not to replace that expertise but to challenge its assumptions, identify where it is producing consistent patterns of good outcomes versus systematic biases, and give it better inputs. The recruiter whose experience-based instincts have been tested against outcome data and validated is a more reliable decision-maker than one whose instincts have never been checked against anything.
What the Experts Say?
The biggest shift I see in mature recruiting functions is not the technology. It is the willingness to ask uncomfortable questions of their own data. Which sources are really producing your best hires? Which interview questions are actually predictive? Which hiring managers are consistently making good decisions and which are consistently making expensive ones? Those questions require data. And most organizations already have the data. They just have not asked the questions yet.
– Madeline Laurano, Founder of Aptitude Research
Building a Data-Driven Recruiting Infrastructure
Step 1: Define the Questions Before Building the Dashboard
The most common data-driven recruiting implementation mistake is building a comprehensive metrics dashboard before defining what decisions the data is supposed to inform. Dashboards built this way tend to report everything and inform nothing: they produce impressive visualizations of data that nobody uses to make different decisions.
The right starting point is a small set of high-stakes questions that the recruiting function currently cannot answer with confidence: Which sourcing channels are producing our best long-tenure hires? What is our true cost per hire when all cost categories are included? Which stage of the funnel is losing the most qualified candidates and why? Start with three to five questions, identify the data required to answer them, and build the infrastructure backward from there.
Step 2: Establish Data Quality Before Analytical Sophistication
Sophisticated analytics built on poor-quality data produce sophisticated-looking wrong answers. Before investing in analytical capability, audit the quality of the data being collected: Are stage transitions being recorded consistently in the ATS? Are source of hire attributions being tracked accurately? Are post-hire performance data connections possible with current system integrations? Data quality investment is rarely glamorous, but it is the prerequisite for analytical reliability.
Step 3: Connect Recruiting Data to Post-Hire Outcomes
This is the step most organizations skip and the one that most distinguishes genuinely data-driven functions from data-adjacent ones. It requires: an agreement with the HRIS or performance management function on data sharing, a defined set of outcome metrics (12-month performance ratings, first-year retention, 90-day manager satisfaction scores), and a data model that connects each hire’s recruiting data to their subsequent performance data.
The technical requirements for this connection are modest. The organizational will to prioritize it is typically the limiting factor. Framing the outcome validation loop as a business case (it enables ROI measurement for every recruiting investment) rather than as a data project is usually more effective for securing the cross-functional cooperation required.
Step 4: Build Analytical Capability in the Team
Data infrastructure without analytical capability produces reports that nobody interprets. Building analytical capability in the TA function means: training recruiters to read and question conversion rate data rather than just reporting it, equipping TA leaders to conduct diagnostic analysis when metrics deviate from benchmarks, and developing the ability to present data-driven findings in terms of business impact rather than recruiting jargon.
Not every recruiter needs to be a data analyst. But every recruiter should be able to look at their funnel conversion data and identify whether it is suggesting a process problem, a sourcing problem, or a market problem. And every TA leader should be able to connect a sourcing investment decision to a projected quality of hire impact.
Key Metrics for a Data-Driven Recruiting Dashboard (2026)
| Metric Category | Key Metrics | Decision It Informs |
|---|---|---|
| Sourcing Effectiveness | Source of hire by channel; cost per qualified applicant by channel; outreach response rate | Sourcing investment allocation |
| Funnel Efficiency | Stage conversion rates; time-in-stage; candidate drop-out type (voluntary vs. org-initiated) | Process design and bottleneck remediation |
| Hiring Speed | Time-to-fill by role type; time-to-offer after final interview; offer response time | Process speed improvement and competitive positioning |
| Cost Efficiency | Cost per hire (full ANSI/SHRM methodology); agency fee dependency rate; referral rate | Budget allocation and build-vs-buy decisions |
| Hire Quality | 90-day new hire performance score; first-year retention rate; hiring manager satisfaction at 30/90/180 days | Assessment design and sourcing strategy validation |
| Equity | Stage conversion rate parity by demographic; adverse impact analysis by assessment tool | DEI program effectiveness and bias identification |
Benchmarks: Recruiting Analytics Maturity by Organization Size (2026)
| Organization Size | Avg. RAMS Score | Data-Driven Decision % | Outcome Validation Rate |
|---|---|---|---|
| Under 200 employees | 1.8 | 22% | 11% |
| 200 to 999 employees | 2.4 | 34% | 19% |
| 1,000 to 4,999 employees | 3.1 | 51% | 38% |
| 5,000+ employees | 3.7 | 67% | 54% |
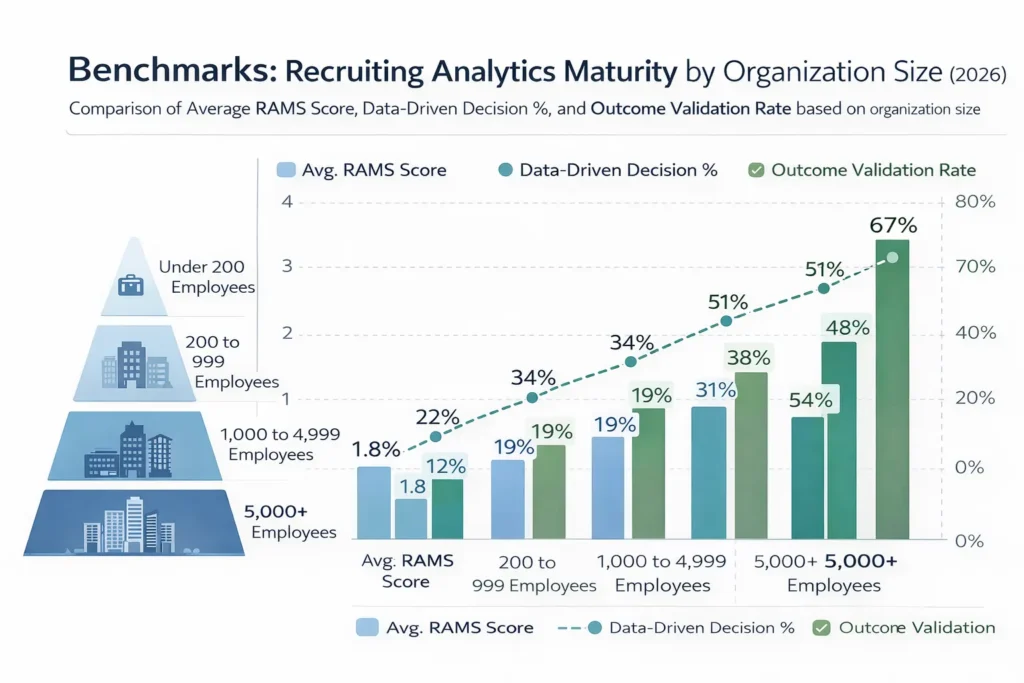
The outcome validation rate (the proportion of organizations that systematically connect recruiting data to post-hire outcomes) is the most telling figure in this table. Even at the largest organizations, nearly half are not closing the loop between their recruiting analytics and hire quality data. This gap represents the single largest opportunity for improvement in recruiting analytics maturity across all organization sizes.
Key Strategies for Building a Data-Driven Recruiting Function
How AI Is Advancing Data-Driven Recruiting?
Automated Metric Collection and Real-Time Dashboards
AI-powered ATS and talent analytics platforms now automate the collection and aggregation of recruiting metrics that previously required manual data compilation. Recruiters and TA leaders can access real-time funnel dashboards, sourcing channel performance data, and time-in-stage analysis without building spreadsheets or waiting for monthly reports. This infrastructure shift has made operational analytics accessible to organizations that could not previously afford the analytical overhead.
Predictive Quality of Hire Modeling
Machine learning models trained on historical recruiting and performance data can generate quality-of-hire probability scores for candidates in the current pipeline, based on the patterns that have historically distinguished high-performing, long-tenure hires from those who underperformed or exited early. These scores are most useful as one input among several in a structured assessment framework, not as standalone decision tools, and they require regular bias auditing to ensure that they are predicting genuine performance rather than demographic proxies.
Natural Language Processing for Interview Data
NLP tools that analyze interview transcripts, asynchronous video responses, and structured behavioral interview recordings for evidence of specific competencies, STAR completeness, and response quality patterns can significantly expand the data available for post-hire outcome analysis. Connecting interview response data to performance outcomes at scale produces insights about which questions and which response patterns are genuinely predictive that would take decades to accumulate through manual analysis.
Anomaly Detection and Process Alerts
AI systems that monitor recruiting process data in real time can identify anomalies that warrant human investigation: a sourcing channel whose application-to-hire conversion rate has dropped significantly, a hiring manager whose time-to-decision has extended beyond norms in ways that are likely to affect offer acceptance, or a role where candidate drop-out between offer and start is exceeding benchmarks. These alerts convert reactive reporting into proactive process management.
Stop Juggling
10 Job Boards.
Search One
Your next role is already here. avua pulls opportunities from across the web into a single searchable feed; filtered by role, location, salary, and remote preference.
1.5 Million+
Active Jobs
380+
Job Categories
Data-Driven Recruiting and Diversity, Equity, and Inclusion
Data-driven recruiting is one of the most powerful tools available for advancing DEI goals in hiring, and one of the easiest to use in ways that inadvertently undermine them. Both dimensions deserve attention.
Data as a DEI Diagnostic
Funnel conversion rate analysis segmented by candidate demographic is the most direct tool for identifying where in the hiring process disparate impact is occurring. If application-to-screen conversion rates show a significant gap by demographic group, this identifies a specific stage and a specific process component for investigation. Without this data, DEI gaps are visible only in outcome metrics (representation data) that lag the process by months or years. With it, they are visible in real time at the stage where intervention is most effective.
The Historical Data Bias Problem
Predictive analytics built on historical hiring data are only as equitable as the historical decisions that produced that data. If an organization’s historical hiring decisions favored certain demographic profiles, candidate profiles that resemble those decisions will score higher in predictive models regardless of whether the favored characteristics are actually job-relevant. Using historical data in predictive recruiting analytics without bias auditing does not create a data-driven process. It creates a data-laundered version of the historical biases.
Addressing this requires: adverse impact analysis of historical data before model training, validation of predictive variables against job performance data rather than just hire data, and regular model auditing as demographic patterns in the candidate market evolve.
Setting Equity Goals with Data
Organizations with specific diversity hiring goals can use data-driven recruiting to set measurable, stage-specific equity targets rather than relying solely on representation metrics. A goal of achieving demographic parity in screen-to-interview conversion rates within two hiring cycles is more actionable than a goal of increasing representation by 10% annually, because it identifies the specific process intervention required and provides a clear near-term metric for progress.
Common Challenges and Solutions
| Challenge | Solution |
|---|---|
| Data Exists But Is Not Being Used for Decisions | Identify three high-stakes decisions that could be improved with existing data; demonstrate the value before expanding scope |
| ATS Data Quality Too Poor for Analysis | Conduct a data quality audit; standardize stage definitions and source tracking before building analytics |
| No Connection Between Recruiting and Post-Hire Data | Prioritize HRIS-ATS integration as a first-year analytics infrastructure investment |
| Recruiters Gaming Metrics Rather Than Improving Outcomes | Reframe data as a process improvement tool rather than performance evaluation; track outcome metrics alongside process metrics |
| Leadership Not Investing in Analytics Capability | Build the ROI case from a single proof-of-concept analysis showing the business impact of a data-informed decision |
Real-World Case Studies
Case Study 1: The Technology Company
A 1,800-person technology company had built a comprehensive recruiting metrics dashboard covering 24 operational metrics. The TA team reviewed the dashboard monthly and presented it to HR leadership quarterly. Despite this investment, time-to-fill for engineering roles had increased from 42 to 67 days over 18 months, and first-year attrition for engineering hires was running at 31%.
A diagnostic audit revealed that the dashboard tracked operational metrics but had no outcome validation: there was no connection between recruiting data and 12-month performance ratings. The team was optimizing process efficiency without knowing whether their process was producing good hires.
Integration of ATS data with the performance management system, built over six weeks by a single data engineer, revealed three actionable findings: candidates sourced from GitHub and developer community forums had a 12-month performance rating 34% higher than those sourced from LinkedIn; candidates who had completed a technical screen with a specific senior engineer had a 28% higher first-year retention rate; and the three-day window between final interview and offer correlated with the highest acceptance rates, while delays beyond seven days were associated with a 41% decline rate.
Twelve months after implementing sourcing and process changes based on these findings, engineering time-to-fill improved from 67 to 44 days and first-year attrition dropped from 31% to 17%. The analytics investment (one data engineer for six weeks) paid back within the first two hiring cycles.
Case Study 2: The Healthcare Network
A regional healthcare network was experiencing persistent difficulty filling nursing roles. Volume sourcing had been the primary strategy: broad job board distribution, multiple contingency agencies, and a high-volume application funnel. Time-to-fill was 58 days on average; offer acceptance rate was 54%.
Data-driven analysis of two years of hiring data revealed that the offer acceptance rate problem was driven almost entirely by two variables: offer timing (the average time from final interview to offer was 11.3 days, during which 38% of candidates accepted competing offers) and compensation positioning (nursing offers were being made at the 42nd percentile of the market, compared to competing health systems at the 55th to 60th percentile).
A third finding was less expected: 67% of nursing hires with strong 18-month retention records had been referred by existing clinical staff, compared to 29% retention among agency-sourced hires and 41% among job-board sourced hires. The referral program had been underinvested because it produced lower volume than job boards, despite producing dramatically better outcomes.
The network redesigned the nursing TA strategy based on these findings: tripled the referral bonus for nursing roles, implemented a 48-hour offer target (requiring pre-approved compensation parameters before final interviews), and adjusted compensation to the 57th market percentile. Within 12 months, offer acceptance rate improved from 54% to 76%, time-to-fill declined from 58 to 39 days, and 18-month retention for new nursing hires improved from 58% to 73%.
Case Study 3: The Professional Services Firm
A consulting firm with 3,200 employees was concerned about diversity in its analyst hiring pipeline. Representation data showed that the proportion of offers made to candidates from underrepresented backgrounds was 23%, significantly below their stated goal of 35%. The intuitive response was to increase diversity sourcing.
Data analysis revealed a more specific problem: the application-to-screen conversion rate for candidates from underrepresented backgrounds was 31%, comparable to the overall rate of 34%, meaning the sourcing was not the primary gap. The screen-to-interview conversion rate was 18% for candidates from underrepresented backgrounds versus 29% overall, a 38% relative gap that indicated something in the screening process was producing disparate impact.
Investigation of screening criteria and recruiter practice revealed that screening was placing disproportionate weight on target university list adherence (a criterion that correlated strongly with socioeconomic background rather than job-relevant performance) and on prior consulting internship experience (which was less accessible to candidates from underrepresented backgrounds due to recruiting network concentration at target schools).
Redesigning the screening criteria to remove the target university list and replace the internship requirement with a structured analytical exercise produced an immediate improvement in screen-to-interview parity. Within two hiring cycles, the screen-to-interview conversion rate gap reduced from 38% to 11%, and the overall proportion of offers made to candidates from underrepresented backgrounds reached 31%, approaching the stated goal without any change to sourcing volume or channel mix.
Building a Data-Driven Recruiting Dashboard: What to Track?
Data-Driven Recruiting Across the Talent Lifecycle
Workforce Planning
Data-driven recruiting enables workforce planning that goes beyond headcount budgeting: modeling the likely time-to-fill and cost-per-hire for each projected opening based on role type and market conditions, identifying the sourcing channels that will produce the required pipeline given current conversion rates, and forecasting the recruiting capacity needed to meet business growth targets.
Sourcing and Assessment
Sourcing strategy, channel allocation, and assessment design are all more effective when informed by historical data on which sources and which assessments have produced the best hires. This is the layer of data-driven recruiting where the most immediate efficiency gains are typically available.
Offer and Retention
Data on offer timing, compensation positioning, and early-tenure engagement provides inputs for offer strategy and onboarding design that connect the recruiting process to the first-year experience. Organizations that track offer-to-start conversion rates, 30-day new hire satisfaction, and 90-day performance ratings alongside their recruiting data have a continuous feedback loop that improves both recruiting and onboarding quality over time.
The Cost of Data-Adjacent Recruiting: By the Numbers
| Decision Quality Level | Annual Hires | Est. Misfire Rate | Annual Replacement Cost | Analytics Investment Required |
|---|---|---|---|---|
| Intuition-Based | 100 | 24% | $672,000 | $0 |
| Data-Adjacent (Reports Only) | 100 | 19% | $532,000 | $15,000 |
| Operationally Data-Driven | 100 | 15% | $420,000 | $45,000 |
| Fully Data-Driven (Outcome Validated) | 100 | 10% | $280,000 | $90,000 |
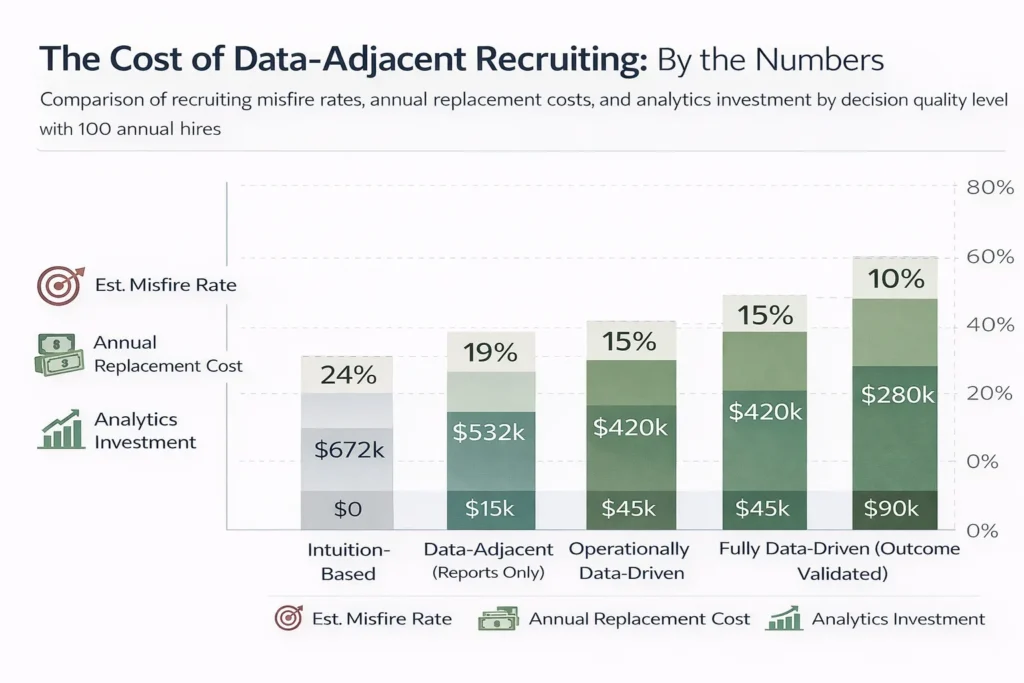
The “misfire rate” is the proportion of hires that underperform significantly or exit within 12 months, at a replacement cost of $28,000 per departed hire. The analytics investment required is the estimated annual cost of the data infrastructure, analytical tools, and capability development at each maturity level. At 100 hires annually, the fully data-driven function saves $392,000 in replacement costs against an $90,000 analytics investment, a 4.4x return. At 200 hires, the return doubles.
Related Terms
| Term | Definition |
|---|---|
| Quality of Hire | A composite measure of the value delivered by new hires, typically assessed through performance ratings and retention; the primary outcome metric that data-driven recruiting is designed to improve |
| Recruiting Analytics | The practice of collecting, analyzing, and interpreting recruiting data to support decision-making; the analytical component of data-driven recruiting |
| Predictive Analytics | The use of historical data and statistical models to forecast future outcomes; in recruiting, used to predict candidate quality, funnel conversion, and hiring timeline |
| Adverse Impact Analysis | A statistical analysis of whether a hiring process or selection tool produces significantly different outcomes for different demographic groups; a required component of equitable data-driven recruiting |
| Source of Hire | The channel or method through which a hired candidate first entered the organization’s pipeline; one of the primary variables in sourcing strategy data analysis |
| Talent Intelligence | Data and analysis about the external talent market, including candidate availability, compensation benchmarks, and competitor hiring activity; a component of the data environment informing data-driven recruiting strategy |
Frequently Asked Questions
What data do you need to start a data-driven recruiting function?
Less than most organizations think. The minimum viable dataset for meaningful analysis includes: source of hire for each application and hire, stage-by-stage conversion rates tracked consistently in the ATS, time-to-fill by role type, cost per hire including all ANSI/SHRM-standard categories, and at least one post-hire outcome metric (90-day manager satisfaction, 12-month retention, or first-year performance rating). Most organizations already have or can readily collect all of this data. The limiting factor is usually not data availability but data quality and the organizational will to use it.
How is data-driven recruiting different from using an ATS?
An ATS is infrastructure. Data-driven recruiting is methodology. An ATS collects and stores recruiting data. A data-driven recruiting function uses that data to answer specific questions, inform specific decisions, and validate specific outcomes. Many organizations have sophisticated ATS infrastructure and are not data-driven because they have not built the analytical layer that translates data into decisions.
What is the biggest risk of data-driven recruiting done poorly?
Encoding historical bias at scale. Predictive models trained on historical hiring data reproduce the patterns in that data, including patterns produced by biased past decisions. An algorithm that predicts “candidate quality” based on historical hire data from a non-diverse organization may be predicting similarity to historical hires rather than genuine job-relevant performance. The risk is not that data-driven recruiting is biased but that it can make bias harder to see by wrapping it in the authority of quantitative output.
How long does it take to build a mature data-driven recruiting function?
Most organizations can achieve operational analytics maturity (consistent metric tracking with decision integration) within six to twelve months with appropriate investment. Predictive analytics capability typically requires 18 to 36 months of data history before models have sufficient training data to be reliable. Full outcome validation maturity, with robust ATS-to-HRIS integration and systematic post-hire feedback loops, typically requires 12 to 24 months of infrastructure development. The timeline compresses significantly for organizations that already have clean ATS data and existing HRIS integration.
Should every recruiter be trained in data analytics?
Not in the sense of being able to build models or write SQL queries. But every recruiter should be comfortable reading conversion rate data, identifying when their funnel metrics are deviating from benchmarks, and interpreting sourcing performance data to make channel allocation decisions. Analytical literacy, not technical expertise, is the baseline capability that data-driven recruiting requires of individual recruiters. The technical work belongs in a dedicated analytics role or a shared HR analytics function.
Conclusion
Data-driven recruiting is not a technology implementation. It is a decision-making discipline. The technology makes it possible. The discipline makes it effective.
What it requires is a genuine commitment to letting evidence challenge assumptions: the assumption that your most experienced recruiter’s instincts are always right, that your most-used sourcing channel is your best one, that the interview questions your hiring managers have been asking for years are actually predicting performance. Some of those assumptions will be confirmed by the data. Others will not.
The organizations that have built genuinely data-driven recruiting functions have not become less human in their hiring. They have become more honest. They have replaced the comfortable fiction of intuition with the uncomfortable discipline of evidence, and in doing so they have become better at the thing recruiting is ultimately for: finding the right people, bringing them in efficiently, and keeping them long enough to deliver the value they were hired to create.
That is what the data is for. And it is worth asking the questions.