eNPS is the ultimate “vibe check” for your organization, turning whispered hallway conversations into a high-stakes performance indicator that determines your company’s future.
The Net Promoter Score transformed how companies think about customer loyalty by collapsing a complex question into a single number: on a scale of 0 to 10, how likely are you to recommend us? The genius was not the question, but the segmentation of Promoters (9-10) versus Detractors (0-6). The same logic applied internally produces the Employee Net Promoter Score (eNPS), a metric that predicts employee behavior, advocacy, and Attrition Rate with striking efficiency throughout the Employee Lifecycle.
The eNPS measures the proportion of employees who would actively recommend the organization, serving as a leading indicator of Candidate Engagement, Employee Branding health, and the overall Employee Experience. In a market where a strong Candidate Pipeline depends on internal reputation, eNPS provides a data-driven signal to ensure your culture attracts top talent and encourages the return of a Boomerang Employee.
The formula is identical to its customer-facing counterpart:
eNPS = Percentage of Promoters (9–10) minus Percentage of Detractors (0–6)
The resulting score ranges from -100 (every employee is a Detractor) to +100 (every employee is a Promoter). In practice, most organizations score between -20 and +50. A score above 10 is generally considered positive; above 30 is strong; above 50 is exceptional. Scores below 0 indicate that Detractors outnumber Promoters, a serious signal of employer brand risk and retention exposure.
In talent acquisition, eNPS is the leading indicator of employee branding quality: Promoters generate referrals, share positive content, and validate the employer’s offer to candidates. Detractors generate negative reviews, warn their networks away, and undermine the official employer brand through the most trusted channel available to candidates: peer-to-peer communication.
What is Employee Net Promoter Score?
eNPS is a single-question survey metric that segments employees into Promoters, Passives, and Detractors based on their likelihood to recommend the organization as a place to work, producing a score that serves as a leading indicator of employee advocacy, employer brand health, attrition risk, and the quality of the employee experience producing those outcomes.
The measurement is typically supplemented by a follow-up open-text question: “What is the primary reason for your score?” This follow-up is where the actionable insight lives: it converts the number into diagnosis, identifying whether the score is driven by compensation concerns, management quality, growth opportunity, culture, or specific organizational events that are elevating or depressing the advocacy baseline.
eNPS differs from general employee engagement surveys in three ways: it is faster to administer (one to two questions versus 12 to 40), it produces a single comparable number rather than a multidimensional profile, and it specifically measures advocacy intent rather than satisfaction or investment in work. These differences make it most useful as a frequent pulse metric and summary indicator rather than a diagnostic instrument.
What Does Your eNPS Actually Tell You?
An eNPS number in isolation tells you the net advocacy position of your employee population at the moment of measurement. It tells you whether Promoters outnumber Detractors, by how much, and how that ratio is changing over time. What it does not tell you, without the follow-up question and without segmentation, is why.
The most common eNPS implementation mistake is treating the number as the endpoint of the measurement. A score of +24 does not tell you whether that score is declining from +38 (a significant warning signal) or improving from +11 (a positive trajectory). It does not tell you whether the score conceals a +52 in engineering and -8 in operations. And without the follow-up question, it does not tell you whether the score is driven by factors the organization can act on (management quality, growth opportunity, recognition) or factors that are harder to influence (market compensation gap, industry conditions).
Research from Bain and Company, the firm that developed the Net Promoter framework, finds that organizations with eNPS above 40 experience 31% lower voluntary attrition and 3.4 times higher employee referral rates than those below 20. The score is not just a satisfaction summary. It is a predictor of the specific behaviors, referrals and retention, that have the most direct impact on talent acquisition effectiveness.
The scenario that makes the diagnostic gap concrete: a 600-person technology company reports an organizational eNPS of +22 in its quarterly pulse. HR reports this to the executive team as a positive result.
What the aggregate score does not show: eNPS in the product engineering team is +51, driven by genuine enthusiasm for the technical work and strong manager relationships. eNPS in the sales team is -14, driven by a combination of aggressive quota revision and a recent management change. The sales team is generating the Glassdoor reviews that are appearing in candidate searches, and three of the last five engineering referrals came from product engineers who were asked by their networks specifically because of the positive content they share publicly.
The aggregate score is +22. The talent acquisition reality is that one team is actively building the employer brand while another is actively undermining it, and none of this is visible without segmented eNPS data.
Your Resume Isn’t Getting Read
Let’s Get That Fixed!
75% of resumes get auto-rejected. avua’s AI Resume Builder optimizes formatting, keywords, and scoring in under 3 minutes, so you land in the “yes” pile.
The eNPS Segmentation: What Each Group Does?
| Segment | Score Range | Behavior Profile | Talent Acquisition Impact |
|---|---|---|---|
| Promoters | 9 to 10 | Actively recommend; refer candidates; create positive brand content | High referral volume; authentic employer brand content; offer acceptance validation |
| Passives | 7 to 8 | Satisfied but not enthusiastic; unlikely to recommend or criticize | Minimal referral activity; neutral brand presence; moderate attrition risk |
| Detractors | 0 to 6 | Actively disengaged; may recommend against; likely to post critical reviews | Negative Glassdoor reviews; network warnings; employer brand erosion |
The talent acquisition implications of each segment are direct. Promoters are the employees who refer strong candidates from their professional networks, who share authentic positive content about their work on LinkedIn, and who validate offers to candidates who reach out to ask what it is really like to work there. Detractors are the employees who post the Glassdoor reviews that decline rates correspond to, who warn their networks about the organization, and who create the credibility gap between the official employer brand and the candidate research reality.
Common Misconceptions About eNPS
| Misconception | Reality |
|---|---|
| A positive eNPS means employees are satisfied | eNPS measures advocacy intent, not satisfaction. An employee can be satisfied with their compensation and disinclined to recommend the organization. Conversely, highly engaged employees in a difficult work environment sometimes score high because they value the challenge even while acknowledging the difficulty. |
| eNPS can substitute for a full engagement survey | eNPS is a summary indicator, not a diagnostic instrument. It tells you the net advocacy position but not the drivers behind it without the follow-up question and additional data. It should supplement, not replace, more detailed engagement measurement. |
| An eNPS above zero is acceptable | In most competitive talent markets, an eNPS above zero but below 20 indicates that the organization is not generating meaningful advocacy. The goal should be building a Promoter majority, not merely avoiding a Detractor majority. |
| eNPS should only be measured annually | eNPS is most valuable as a frequent pulse: quarterly at minimum, monthly for organizations undergoing significant change. Annual eNPS produces a data point; quarterly eNPS produces a trend line that enables early intervention. |
| All Detractors are disengaged employees | Some Detractors are high-performing employees who would not recommend the organization because of a specific unresolved concern (compensation, workload, specific management behavior) rather than broad disengagement. These are the Detractors most worth investigating and acting on. |
| eNPS is primarily a retention metric | eNPS is simultaneously a retention metric (Detractors have higher voluntary attrition rates), an employer brand metric (Detractors generate negative reviews), and a talent acquisition metric (Promoters generate referrals). All three dimensions have direct financial impact. |
eNPS vs. Related Metrics
| Metric | Question | What It Measures | Best Used For |
|---|---|---|---|
| eNPS | “Would you recommend this organization as a place to work?” | Employee advocacy intent | Employer brand health; attrition leading indicator |
| Employee Engagement Score | Multi-item survey across engagement dimensions | Investment in work and organization | Engagement driver diagnosis; manager effectiveness |
| Employee Satisfaction Score | “How satisfied are you with your job?” | Contentment with conditions | Compensation and benefits benchmarking |
| Glassdoor Rating | Public review score | External employer perception | Candidate research stage brand signal |
| Retention Rate | % still employed at period end | Actual attrition outcome | Retention program effectiveness measurement |
| Stay Interview Score | Structured qualitative retention assessment | Specific retention risk factors | Individual retention action planning |
What the Experts Say?
eNPS is the simplest honest question you can ask your employees. Not ‘are you happy?’ Not ‘are you engaged?’ But ‘would you put your name behind this organization to someone you care about?’ That question has a social and reputational cost attached to it, and that cost is what makes the answer meaningful.
– Frederick Reichheld, Inventor of the Net Promoter System and Bain Fellow
How to Build an Effective eNPS Program?
Step 1: Establish a Measurement Cadence
eNPS should be measured at a frequency that enables trend detection: quarterly is the minimum effective cadence; monthly is appropriate for organizations experiencing significant change or with a known engagement concern requiring monitoring. Annual measurement produces data points that are too infrequent to identify the emerging signals that enable timely intervention.
Step 2: Always Include the Follow-Up Question
The score alone identifies the advocacy position. The follow-up (“What is the primary reason for your score?”) provides the diagnosis. The open-text responses to this question should be analyzed for themes at the organizational level and the unit level, coded for the primary driver categories (management quality, compensation, growth opportunity, culture, workload), and reviewed alongside the score to inform action priorities.
Step 3: Disaggregate by Unit, Manager, Tenure, and Demographic Group
Organizational eNPS conceals the variance that is operationally most important. Team-level eNPS identifies the specific managers whose behavior is driving Promoter or Detractor concentration. Tenure-cohort eNPS identifies the lifecycle stages where advocacy drops (often at the 18 to 36-month mark, driven by development experience quality). Demographic-group eNPS surfaces the inclusion gaps that aggregate scores conceal.
Step 4: Act Visibly Within 30 Days
Every eNPS measurement cycle should be followed by a visible communication of what was heard and what will change. At the organizational level: what themes were identified and what organizational response is planned. At the team level: what the team’s score was and what the manager plans to address. Organizations that survey and then visibly fail to act produce declining participation rates and increasing cynicism that reduces the score’s validity over time.
eNPS Benchmarks by Industry (2026)
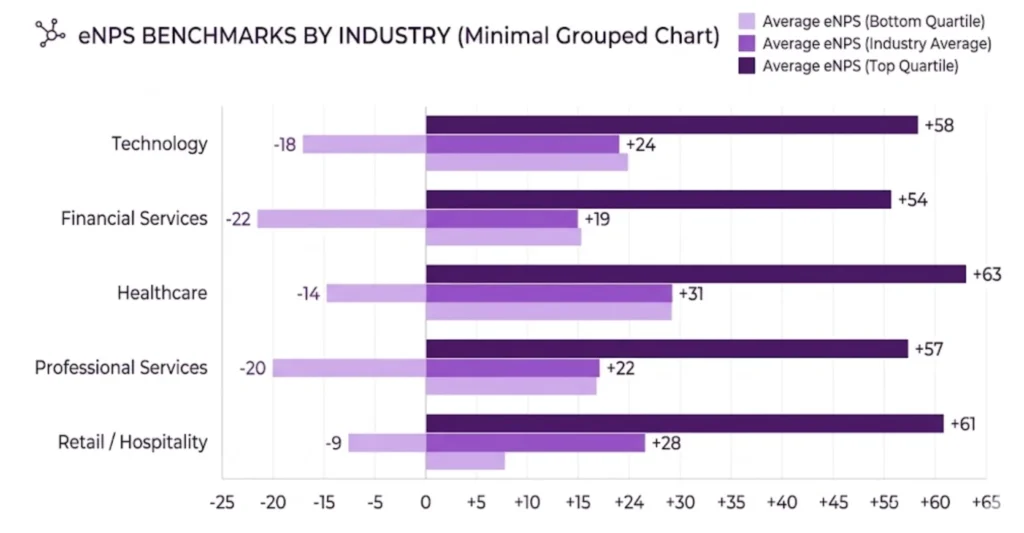
| Industry | Avg. eNPS | Promoter % | Detractor % | Top Driver of Detractor Scores |
|---|---|---|---|---|
| Technology | 24 | 44% | 20% | Growth opportunity; equity compensation |
| Healthcare | 17 | 38% | 21% | Workload; management quality |
| Financial Services | 21 | 41% | 20% | Compensation; career path visibility |
| Retail | 8 | 31% | 23% | Management quality; scheduling flexibility |
| Manufacturing | 12 | 34% | 22% | Recognition; physical working conditions |
| Professional Services | 28 | 47% | 19% | Work-life balance; project quality |
| Nonprofit | 34 | 52% | 18% | Purpose alignment; compensation |
The nonprofit sector’s consistently higher eNPS reflects the purpose-connection advantage: employees in mission-driven organizations score higher on the advocacy dimension because they are recommending not just a workplace but a cause. The retail sector’s lower eNPS reflects the management quality and scheduling challenges inherent in high-turnover, distributed workforces.
Key Strategies for Improving eNPS
How AI Is Enhancing eNPS Programs?
Quick-Reference Cheat Sheet
eNPS = Percentage of Promoters (9–10) minus Percentage of Detractors (0–6)
Score Interpretation:
- Above 50: Exceptional; strong referral and brand advocacy engine.
- 30 to 50: Strong; competitive employer brand position.
- 10 to 30: Positive; room for improvement.
- 0 to 10: Neutral; Passives and Detractors in balance.
- Below 0: At-risk; Detractors outnumber Promoters.
Dos:
Don’ts:
Common Challenges and Solutions
| Challenge | Solution |
|---|---|
| Low Survey Participation Rate | Shorten to 2 questions; demonstrate prior action from survey results; communicate confidentiality clearly |
| Score Fluctuating Widely Between Cycles | Check for events (RIF, leadership change, compensation cycle) that create measurement timing effects; use rolling average |
| High Score Despite High Attrition | Cross-check with actual attrition data; investigate whether high-scoring employees are the ones leaving (indicating score reliability issues) |
| Managers Coaching Employees on Responses | Remove manager access to individual responses; communicate aggregation methodology; address through manager behavior standards |
| eNPS Improving Without Engagement Improving | eNPS and engagement measure different things; supplement eNPS with engagement item data to identify whether advocacy and investment are moving together |
When (and When Not) to Use This Metric?
Every measurement tool has a sweet spot, and this one is no different. The value of a single-question advocacy score depends entirely on context, your company’s stage, workforce size, and the organizational moment you’re operating in.
Where It Works Best?
Scaling organizations between 100 and 5,000 employees get the most from this approach. At that size, you have enough respondents for statistical reliability across departments while still being nimble enough to act on findings within weeks. Post-merger integrations are another high-value window. When two cultures collide, a lightweight pulse on employee advocacy gives leadership an honest temperature check without the six-week turnaround of a full engagement survey.
Remote-first and hybrid transitions also create fertile ground. Teams adjusting to distributed work often struggle to articulate what feels different. A quick advocacy question, paired with an open-ended follow-up, surfaces friction points like eroded belonging, unclear communication norms, or manager invisibility, patterns that traditional engagement surveys tend to bury inside 60-question instruments.
Organizations rolling out major policy changes, new compensation structures, return-to-office mandates, leadership reshuffles, benefit from deploying this metric shortly before and after the change. That before-and-after delta tells you more than either score alone. It isolates the impact of a specific decision rather than measuring general organizational mood.
Where It Falls Short?
Teams smaller than 20 people should be cautious. With that few respondents, one disgruntled individual swings the score by 10–15 points, making the number unreliable as a trend indicator. In micro-teams, direct conversation and stay interviews give you richer, more actionable insight.
Avoid deploying the survey immediately after traumatic organizational events; mass layoffs, executive scandals, safety incidents. Scores captured during acute emotional responses reflect crisis reaction, not underlying sentiment. Wait at least four to six weeks for the initial shock to settle before measuring. Otherwise, you are tracking grief, not engagement.
Organizations already suffering from survey fatigue should think twice before stacking another measurement cycle on top of existing pulse surveys, annual engagement instruments, and manager feedback forms. If employees already feel over-surveyed and under-heard, adding one more question does not fix the problem, it compounds it. The prerequisite is a functioning feedback loop, not more data collection.
Finally, this score should never be used as a standalone performance metric for managers. The moment team-level scores get tied to bonuses or promotion decisions, gaming behavior kicks in. Managers start lobbying employees before survey windows. Respondents start inflating answers to protect a manager they like. The data loses integrity, and the entire program collapses into theater.
Related Terms
| Term | Definition |
|---|---|
| Net Promoter Score (NPS) | The customer-facing equivalent of eNPS; the framework from which eNPS is derived |
| Employee Engagement Score | A multidimensional survey metric measuring investment in work and organization; the diagnostic complement to eNPS |
| Employer Brand | The external perception of the organization as a place to work; directly influenced by eNPS through Promoter content and Detractor reviews |
| Employee Referral Rate | The proportion of hires sourced through employee referrals; the talent acquisition output most directly predicted by eNPS |
| Voluntary Attrition Rate | The proportion of employees who leave the organization voluntarily; inversely correlated with eNPS at the unit level |
Frequently Asked Questions
What is a good eNPS score?
Context matters significantly. An eNPS of +22 in retail is exceptional; the same score in a nonprofit might indicate a problem. The most relevant benchmarks are industry-specific and peer-group-specific. In general: above +30 is strong in most industries; above +40 is exceptional. More important than the absolute score is the trend: a score improving from +10 to +22 over four quarters is a stronger positive signal than a static +28.
How does eNPS relate to actual referral behavior?
The correlation between eNPS and actual referral rates is strong but not perfect. Promoters have higher referral rates than Passives and Detractors, but not all Promoters refer candidates: some are not in professional networks aligned with the organization’s hiring needs; some are not aware of open roles; some are enthusiastic about the organization but not in the habit of referring. Active referral programs that make it easy for Promoters to refer, and that communicate open roles to them specifically, convert the advocacy intention captured by eNPS into the referral behavior that produces pipeline.
Should eNPS be anonymous?
Yes, at the individual level. Anonymity is required for honest responses, particularly for Detractors who may fear that a low score will affect their standing. Responses should be aggregated before being shared with any manager or leader. The follow-up question text should also be anonymized before theme analysis to prevent individual identification. The minimum group size for reporting (typically five or more employees) should be communicated to survey participants.
How often should the eNPS question wording be changed?
It should not be changed. The value of eNPS is in longitudinal trend comparison, which requires the same question asked in the same format over time. Rewording the question, even slightly, breaks the trend line. Any changes to survey format, timing, or supplementary questions should be documented as methodology changes when interpreting trend data.
Conclusion
The eNPS is a deceptively simple metric. One question, three segments, one number. The simplicity is its strength: it is fast enough to measure frequently, clear enough to communicate to any organizational audience, and specific enough in what it measures, advocacy intent, to predict the specific employee behaviors that matter most for employer brand and talent acquisition.
But its value is entirely dependent on what the organization does with it. An eNPS that is measured annually, reported as an aggregate, and not acted on is not an employee advocacy program. It is a number in a slide deck.
An eNPS that is measured quarterly, disaggregated by team and tenure, supplemented by follow-up diagnosis, and acted on visibly at the manager level is a system for continuously improving the employee experience in ways that convert employees into the most credible brand advocates available: people who have something real to lose by recommending a place they do not genuinely believe in.
That credibility is what makes the eNPS worth the investment. And that credibility is what makes Promoters matter.