Abandonment rate in recruitment refers to the percentage of job applicants who begin but do not complete an application process. It is calculated by dividing the number of incomplete applications by the total number of applications started, then multiplying by 100.
In the context of AI-powered hiring platforms, abandonment rate serves as a critical diagnostic metric, it quantifies exactly where friction exists between a candidate’s intent to apply and their follow-through, revealing whether your application funnel is a bridge or a barrier.
What is Abandonment Rate?
Abandonment rate in recruitment measures the percentage of candidates who start a job application but leave before completing it. It highlights friction points in the application process that prevent potential talent from entering the hiring pipeline.
Does Your AI Hiring Abandonment Rate Predict Failure?
In traditional hiring, a high abandonment rate was often invisible, recruiters simply never saw the candidates who gave up. AI hiring platforms change this dynamic by making every drop-off point measurable. When an AI-driven ATS tracks that 92 out of every 100 candidates who click “Apply” never finish, it transforms an abstract feeling of “we’re not getting enough applicants” into a precise, fixable problem.
For talent acquisition leaders, abandonment rate is the earliest signal of candidate experience failure. A bloated application; one that asks for a resume upload and then forces manual re-entry of the same data, will haemorrhage candidates before the hiring algorithm ever gets a chance to evaluate them. This means your AI screening tools, no matter how sophisticated, are operating on a self-selected, patience-filtered subset of the talent pool, not the full market.
Reducing abandonment rate has a direct multiplier effect on hiring outcomes. If a company receives 1,000 application starts per month at a 92% abandonment rate, only 80 complete applications reach the funnel. Cutting abandonment to 60% triples that number to 400 completed applications; without spending an additional penny on sourcing. In an era where cost-per-hire is under constant scrutiny, optimising your application completion rate is the single highest-ROI investment most recruiting teams can make.
AI Resume Builder
Your resume isn’t
getting read.
Let’s fix that.
75% of resumes get auto-rejected. Avua’s AI Resume Builder optimizes formatting, keywords, and scoring in under 3 minutes — so you land in the “yes” pile.
The Psychology Behind Application Abandonment
Understanding why candidates abandon applications requires looking beyond UX metrics and into behavioural psychology. Job seekers don’t just drop off because a form is long, they drop off because something in the process triggers a negative emotional response. Recognising these triggers is the first step toward designing application flows that feel effortless.
Cognitive Load and Decision Fatigue
Every additional field in a job application adds cognitive load. Research in behavioural economics shows that when people face too many decisions in sequence, the quality of their choices deteriorates; a phenomenon known as decision fatigue. For a candidate who’s already spent energy browsing job boards, reading descriptions, and evaluating fit, a 25-field application form can feel like the last straw. The mental calculus becomes simple: “Is this particular role worth the effort of completing this form?” More often than not, the answer is no.
The Paradox of Commitment Escalation
There’s a fascinating tension at play. On one hand, candidates who invest more time in an application are more committed. On the other hand, asking for that investment upfront, before the candidate has any signal of reciprocal interest from the employer, feels asymmetric. Smart application design leverages progressive commitment: collect minimal information first, screen quickly, and then ask engaged candidates to provide more details. This mirrors how trust-building works in any relationship, you earn the right to ask for more by giving something back first.
Loss Aversion and Sunk Cost
Candidates who are 70% through a lengthy application face a sunk-cost dilemma: abandon the time already spent, or push through despite frustration. Some recruiters assume this works in their favour, that candidates will power through. But the data tells a different story. When frustration exceeds a threshold, candidates not only abandon the application but also develop a negative association with the employer brand. Loss aversion cuts both ways: the candidate “loses” their time investment, and the employer loses a potentially great hire along with brand goodwill.
Abandonment Rate vs. Other Recruitment Funnel Metrics
Abandonment rate doesn’t exist in isolation. It’s one piece of a larger recruitment funnel puzzle. Understanding how it relates to, and differs from, other common hiring metrics helps you figure out where the real bottleneck sits — and avoid fixing the wrong thing.
| Metric | What It Measures | Key Difference from Abandonment Rate |
|---|---|---|
| Abandonment Rate | % of candidates who start but don’t finish an application | — This IS the metric |
| Conversion Rate | % of candidates moving from one stage to the next | Broader scope; covers the entire funnel, not just the application step |
| Offer Acceptance Rate | % of offers accepted by candidates | Measures the end of the funnel; abandonment is the top |
| Time to Fill | Days from requisition to accepted offer | A lagging indicator; high abandonment inflates time to fill |
| Source of Hire | Which channels produce hires | Doesn’t reveal in-funnel friction; a great source can still have high abandonment |
| Quality of Hire | Performance and retention of new hires | A downstream outcome; high abandonment may filter out quality candidates before they’re ever assessed |
The key insight here is that abandonment rate acts as a leading indicator. If it’s high, downstream metrics like time-to-fill and quality-of-hire will almost certainly suffer. Fixing abandonment first often creates a cascading improvement across the rest of your funnel.
What the Experts Say?
The best predictor of a company’s hiring success isn’t their employer brand or their compensation package, it’s whether a candidate can finish applying in under five minutes on their phone. Every additional minute you add to the process, you lose roughly 10% of your applicant pool.
Josh Bersin, Global Industry Analyst
How to Measure and Reduce Abandonment Rate?
Formula
Abandonment Rate (%) = (Incomplete Applications ÷ Total Applications Started) × 100
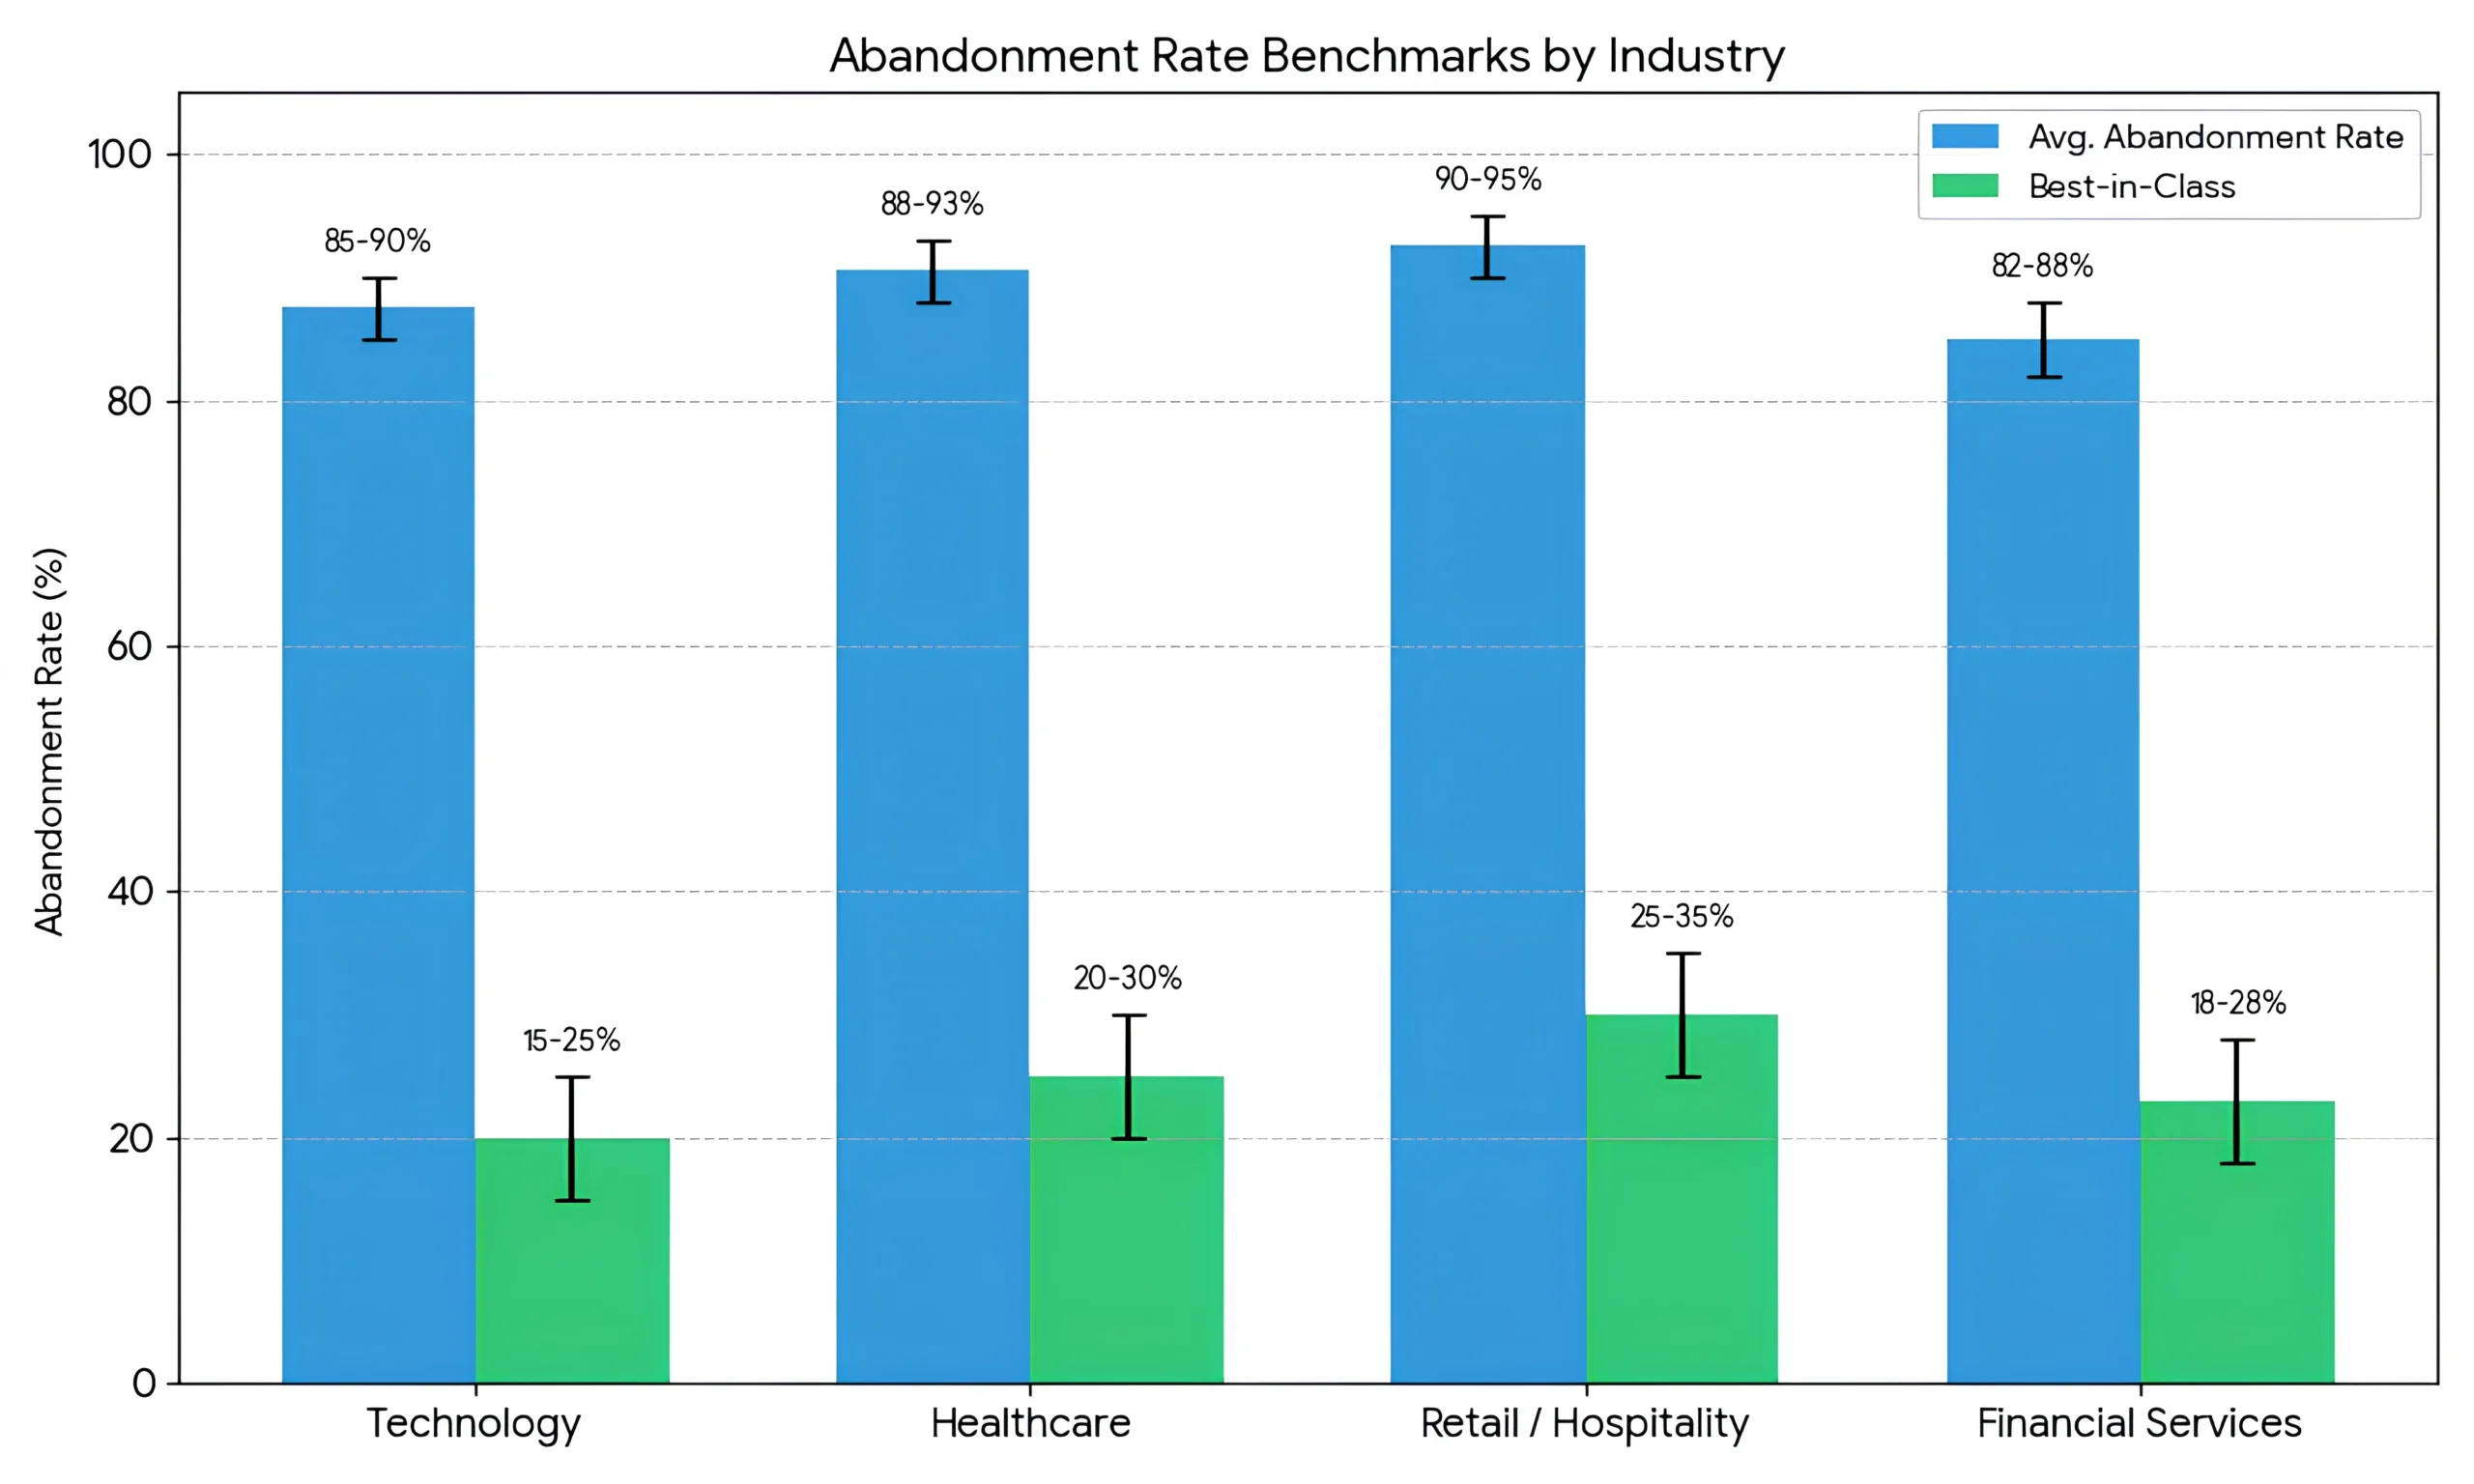
Benchmarks by Industry
| Industry | Avg. Abandonment Rate | Best-in-Class |
|---|---|---|
| Technology | 85–90% | 15–25% |
| Healthcare | 88–93% | 20–30% |
| Retail / Hospitality | 90–95% | 25–35% |
| Financial Services | 82–88% | 18–28% |
Key Reduction Strategies
How can AI and Automation Solve Abandonment?
We’ve established that shorter, smarter application forms reduce drop-offs. But let’s go deeper into how AI specifically powers this transformation, because not all automation is created equal.
Intelligent Resume Parsing and Auto-Fill
Modern AI parsers don’t just extract text from a PDF, they understand context. They can differentiate between a job title and a company name, parse non-linear resume formats, and handle multilingual documents. When a candidate uploads a resume, the AI pre-populates work history, education, skills, and contact details with high accuracy. The candidate’s job shifts from “filling out a form” to “verifying auto-filled information,” which is a fundamentally less effortful task.
Chatbot-Assisted Applications
Conversational AI interfaces are replacing traditional form-based applications in some forward-thinking companies. Instead of presenting a candidate with a wall of fields, a chatbot guides them through a dialogue: “What role are you applying for? Great. Can you upload your resume? Perfect — I’ve pulled in your details. Anything you’d like to update?” This approach reduces perceived effort and gives the candidate a sense of interaction rather than data entry.
Predictive Drop-Off Intervention
Some AI platforms can detect when a candidate is likely to abandon based on behavioural signals: long pauses between fields, repeated backtracking, or hovering near the close button. When this happens, the system can trigger real-time interventions, a motivational nudge (“You’re 80% done!”), a simplified path (“Skip this section for now”), or a save-and-return prompt. Think of it as real-time UX triage.
Automated Follow-Up Sequences
For candidates who do abandon, AI-powered follow-up sequences can re-engage them. A well-timed email 24 hours later (“We noticed you started your application for [Role]. Pick up where you left off?”) with a direct deep-link back to their saved progress can recover a meaningful percentage of drop-offs. The timing, tone, and channel of these messages can be A/B tested and optimised by machine learning models over time.
1.5M+ Jobs Live
Stop juggling
10 job boards.
Search one.
Your next role is already here. avua pulls opportunities from across the web into a single searchable feed — filtered by role, location, salary, and remote preference.
Abandonment Rate and Diversity & Inclusion
Here’s something that doesn’t get discussed enough: high abandonment rates have an outsized impact on diversity hiring. Complex application processes disproportionately affect candidates from underrepresented backgrounds, and here’s why.
Digital Access and Literacy Gaps
Not every candidate has a high-speed internet connection, a modern laptop, or fluency navigating complex web forms. Candidates applying from public libraries, shared devices, or older smartphones are more likely to encounter technical friction. When your application requires file uploads in specific formats, account creation with email verification, or multi-step authentication, you’re inadvertently filtering by digital privilege.
Language and Accessibility Barriers
Applications that aren’t available in multiple languages, or that lack screen-reader compatibility, create invisible walls. A candidate with a visual impairment navigating a form that isn’t WCAG-compliant will abandon not because they aren’t qualified, but because the system wasn’t designed with them in mind. Similarly, non-native speakers may struggle with jargon-heavy application questions, leading to abandonment born of confusion rather than lack of interest.
Bias in Self-Selection
Research consistently shows that women and candidates from minority groups are more likely to self-select out of application processes they perceive as demanding or gatekeeping-heavy. If your application front-loads requirements (“Must have 10 years of experience, MBA preferred”) before the candidate even gets to the form, you’re amplifying this effect. Reducing abandonment isn’t just a UX issue, it’s a DEI issue.
Common Challenges & Solutions
| Challenge | Solution |
|---|---|
| Compliance-heavy industries require lengthy applications (background checks, certifications). | Break the process into stages. Collect essentials first for screening; request compliance data only from shortlisted candidates. |
| Candidates abandon because they cannot gauge role fit early enough. | Use AI-powered job matching or a short pre-qualification quiz upfront so candidates self-select before investing time in a full application. |
| Analytics show high abandonment but no clear “why.” | Deploy session-recording tools or micro-surveys at exit points. Even a single question (“What stopped you from completing?”) yields actionable data. |
Real-World Case Studies: What Actually Moved the Needle?
Theory is great, but what does abandonment rate reduction look like in practice? Here are three composite scenarios drawn from common patterns across AI hiring platforms.
Case Study 1: A Mid-Size SaaS Company Cuts Abandonment by 55%
A B2B SaaS company with 800 employees was seeing a 91% abandonment rate on engineering roles. Their application required a cover letter, three references, salary expectations, and a coding challenge link, all upfront. After an audit, they restructured: the initial application became resume-only with AI parsing. Candidates who passed the AI screen were then invited to complete additional steps. Result: abandonment dropped to 36%, and their engineering pipeline tripled in volume without any increase in sourcing spend.
Case Study 2: A Healthcare System Recovers 22% of Abandoned Applications
A regional hospital network faced 93% abandonment on nursing positions. The compliance-heavy application (license verification, background consent, credential uploads) was unavoidable. Instead of shortening the form, they implemented save-and-return functionality with automated SMS reminders at 4-hour and 24-hour intervals. They also added a progress bar and broke the form into five clearly labelled stages. Recovery rate from abandoned sessions hit 22%, adding roughly 180 completed applications per month.
Case Study 3: A Retail Chain Redesigns for Mobile-First
A national retail chain with 2,000+ locations found that 78% of their applicants started applications on mobile, but mobile abandonment was 96% compared to 74% on desktop. The culprit: a non-responsive form that required horizontal scrolling and had tiny tap targets. After a mobile-first redesign with auto-fill via Google/LinkedIn SSO and thumb-friendly large buttons, mobile abandonment dropped to 52%. Total application completions increased by 140%.
Building an Abandonment Rate Dashboard: What to Track?
If you’re serious about treating abandonment rate as a strategic KPI, you need a dedicated dashboard. Here’s what belongs on it.
Abandonment Rate Across the Candidate Lifecycle
While we typically talk about abandonment rate in the context of job applications, the concept extends to other stages of the candidate lifecycle. Recognising this broader view helps recruitment teams address friction holistically.
Pre-Application Abandonment
Candidates can “abandon” before they even click “Apply.” If your job description is vague, riddled with jargon, or lists 20 requirements for a mid-level role, qualified candidates will bounce from the listing page. Tracking the ratio of job-page views to application starts gives you a proxy for pre-application abandonment.
Assessment Abandonment
Many hiring processes include assessments; skills tests, personality questionnaires, video interviews; after the initial application. Abandonment at this stage is often higher than at the application itself, especially if the assessment is lengthy, poorly explained, or feels irrelevant to the role. Keeping assessments under 20 minutes and clearly communicating their purpose upfront reduces this drop-off.
Interview Scheduling Abandonment
You’d be surprised how many candidates drop out simply because scheduling is painful. If a recruiter sends an email asking the candidate to “suggest some times,” the back-and-forth friction can cause disengagement. Self-service scheduling tools that let candidates pick a slot in one click dramatically reduce this form of abandonment.
Offer-Stage Abandonment
Even after receiving an offer, candidates can go silent. This usually stems from slow offer delivery, unclear compensation details, or a better competing offer arriving during a lag. Speed and transparency at the offer stage are critical: automate offer letter generation, present total compensation clearly, and set short but reasonable decision windows.
The Real Cost of Abandonment: By the Numbers
Let’s talk money, time, and missed opportunity. Abandonment rate isn’t just a UX inconvenience, it’s a line item on your P&L whether you see it there or not. Here’s what the data actually looks like when you zoom out.
The Financial Impact Table
The table below models what abandonment costs a company hiring 100 roles per year, assuming an average cost-per-application-start of $12 (factoring in job board spend, employer branding, and recruiter time that drives a candidate to click “Apply”).
| Scenario | Abandonment Rate | Wasted Sourcing Spend / Year | Completed Apps / Month |
|---|---|---|---|
| Industry Average | 92% | $132,480 | 80 |
| Moderate Improvement | 70% | $100,800 | 300 |
| Good | 50% | $72,000 | 500 |
| Best-in-Class | 20% | $28,800 | 800 |
That’s a swing of over $100,000 in wasted sourcing spend between the industry average and best-in-class, and that’s before you factor in the downstream costs of slower time-to-fill, recruiter overtime, and missed revenue from unfilled roles. For enterprise companies hiring 500+ roles per year, this number balloons into the millions.
Key Stats That Should Keep Recruiters Up at Night
- 92%: The average application abandonment rate across industries. For every 100 candidates who click “Apply,” only 8 make it through. That’s not a funnel, that’s a sieve.
- 73%: The percentage of candidates who say they’ve abandoned a job application because the process was too long or complicated. Nearly three out of four.
- 60%: The share of candidates who abandon mid-application specifically because they were asked to re-enter information already on their resume. This is the single most fixable friction point in all of recruitment.
- 3.5x: Candidates who abandon a frustrating application are 3.5 times more likely to leave a negative employer review on Glassdoor or similar platforms. Your broken form is actively damaging your brand in public.
- $4,700: The average cost-per-hire in the United States. Every point of abandonment you reduce is money saved from this number, because you need less sourcing spend to fill the same pipeline.
- 42 days: The average time-to-fill across industries. Companies with high abandonment rates consistently sit above this benchmark because their pipeline volume is artificially throttled by a broken application experience.
- 5 minutes: The threshold. Applications that take longer than 5 minutes to complete see abandonment rates spike by 15–20 percentage points compared to those under this mark. Five minutes is the line between “reasonable” and “I’ll apply somewhere else.”
- 15–20%: The recovery rate achievable through save-and-return functionality combined with automated reminders. That’s free pipeline, candidates who already showed intent but just needed a nudge to finish.
The Hidden Multiplier: Opportunity Cost
Here’s the stat that rarely makes it into reports because it’s harder to quantify: for every role that stays unfilled for an extra 20 days due to pipeline volume issues caused by abandonment, the business loses an estimated $500–$1,500 per day in unrealised productivity (varies by role seniority). A sales role sitting vacant for three extra weeks? That’s $15,000–$30,000 in lost revenue potential. An engineering role? Delayed product features, missed sprint commitments, and compounding technical debt.
The point isn’t to scare you with numbers, it’s to reframe abandonment rate from a “nice to improve” metric into a “this is costing us real money every single month” metric. Once it’s on the CFO’s radar, the budget for fixing it tends to materialise pretty quickly.
Global and Generational Abandonment Trends
Abandonment rate isn’t a one-size-fits-all number. It shifts dramatically depending on where your candidates are located, how old they are, and what kind of device they’re using. If you’re hiring globally or across age demographics, these patterns matter.
Abandonment by Region
| Region | Avg. Abandonment Rate | Key Driver |
|---|---|---|
| North America | 88–92% | Long, compliance-heavy forms; account-creation walls |
| Western Europe | 80–88% | GDPR consent steps add friction; multi-language needs |
| Asia-Pacific | 85–93% | Mobile-first populations on non-responsive forms |
| Middle East & Africa | 90–96% | Bandwidth constraints; timeout abandonment on limited data |
| Latin America | 87–94% | Language barriers; fewer localised application portals |
The takeaway? If you’re hiring in regions with high mobile dependency or limited bandwidth, lightweight application forms aren’t just nice to have — they’re essential. A 2MB image-heavy career page that loads in 2 seconds on fibre in San Francisco might take 30 seconds on a 3G connection in Lagos. And 30 seconds is an eternity when you’re competing for attention.
Abandonment by Generation
| Generation | Avg. Abandonment | Biggest Frustration | What They Expect |
|---|---|---|---|
| Gen Z (18–28) | 94–97% | Anything that feels like homework; no instant gratification | One-tap apply, mobile-native, instant feedback |
| Millennials (29–43) | 88–92% | Redundant data entry; creating yet another account | LinkedIn/SSO apply, resume parsing, save-and-return |
| Gen X (44–59) | 78–85% | Unclear job descriptions; vague next steps | Transparency, clear timelines, straightforward forms |
| Boomers (60+) | 70–80% | Complex navigation; small text and buttons | Accessible design, phone support, large tap targets |
Notice the pattern? Younger candidates abandon at higher rates, not because they’re less interested, but because they have zero tolerance for friction. They’ve grown up with one-click purchases, instant streaming, and apps that anticipate their needs. A 15-minute job application feels absurd when ordering dinner takes 30 seconds.
Device-Level Breakdown: The Mobile Gap is Widening
| Device | % of App Starts | Avg. Abandonment | Avg. Completion Time |
|---|---|---|---|
| Desktop | 33% | 74% | 8.2 minutes |
| Mobile | 58% | 94% | 14.6 minutes |
| Tablet | 9% | 82% | 10.1 minutes |
58% of applications now start on mobile, but mobile abandonment runs 20 percentage points higher than desktop. The completion time gap is even more revealing, the same application takes nearly twice as long on a phone. This isn’t a candidate problem; it’s a design problem.
How Job Descriptions Fuel Abandonment Before a Single Field is Filled?
Most conversations about abandonment rate focus on the application form itself. But there’s a quieter, earlier stage of abandonment that’s just as damaging: the job description page. If candidates bounce before they even click “Apply,” your form optimisation doesn’t matter — because they never saw the form.
The Listing-to-Apply Click-Through Problem
Industry data suggests that only 8–12% of candidates who view a job listing actually click “Apply.” That means 88–92% of interested eyeballs are lost at the description stage alone. While not technically “application abandonment” in the traditional sense, this pre-application drop-off feeds directly into the same pipeline problem.
The Six Description Killers
Unrealistic requirements lists: Job descriptions with 15+ requirements signal to candidates that they need to be a perfect match. Studies show men typically apply when meeting about 60% of requirements, while women tend to apply only at 100%. A bloated requirements section silently filters out diverse talent.
- Vague or generic descriptions: Listings that read like they were written by a committee (“we’re looking for a rock star who’s passionate about innovation”) tell the candidate nothing about the actual day-to-day role. When candidates can’t picture themselves in the job, they don’t apply.
- No salary range: In an era of pay transparency, omitting compensation is a trust signal, and not a positive one. Candidates increasingly skip listings without salary ranges because they don’t want to invest time applying only to discover the pay doesn’t match.
- Wall-of-text formatting: A job description with 1,200 words in dense paragraphs and no visual hierarchy is exhausting to read, especially on mobile. Candidates skim, if they can’t find what they need in 30 seconds, they’re gone.
- Missing employer value proposition: The listing talks about what the company needs but says nothing about what the candidate gets. Benefits, culture, growth, remote flexibility, these are the reason a candidate chooses your listing over the twelve others in their browser tabs.
- Outdated or broken listing pages: Dead links, broken “Apply” buttons, or listings open for 6+ months without updates signal that nobody’s on the other end. If the listing looks neglected, candidates assume the hiring process will be too.
The Fix: Treat Your Job Description Like a Landing Page
The best recruiting teams approach job descriptions the way marketers approach landing pages: with conversion in mind. Clear headlines, scannable formatting, a compelling value proposition above the fold, social proof (team photos, Glassdoor rating, awards), and a prominently placed, mobile-friendly “Apply” CTA. When the listing page is optimised, it lifts the click-through rate, which lifts application starts, which gives your application form more candidates to convert.
The 10-Point Abandonment Rate Audit Checklist
Not sure where to start? Run through this quick diagnostic. If you can’t confidently answer “yes” to at least 7 of these, your application experience has room to improve.
| # | Audit Question | Yes / No |
|---|---|---|
| 1 | Can a candidate complete the application in under 5 minutes on a smartphone? | |
| 2 | Does the application auto-fill fields from a resume upload or LinkedIn profile? | |
| 3 | Can candidates apply without creating an account first? | |
| 4 | Is there a save-and-return option with automated reminders? | |
| 5 | Does the application include a progress bar or step indicator? | |
| 6 | Are compliance-heavy fields deferred to later stages? | |
| 7 | Do you have funnel analytics showing the exact step where candidates drop off? | |
| 8 | Is the job description page optimised with salary range, clear formatting, and a prominent CTA? | |
| 9 | Have you tested the application on at least 3 different mobile devices in the last 90 days? | |
| 10 | Do you run automated follow-up sequences for candidates who abandon mid-application? |
Pro Tip: Hand your phone to someone outside the recruiting team and ask them to complete a test application while you watch. Don’t coach, don’t explain, just observe. You’ll learn more in 5 minutes of watching someone struggle with your form than from a month of analytics dashboards.
Related Terms
| Applicant Tracking System (ATS) | Software that automates the collection, sorting, and tracking of job applications throughout the hiring pipeline. |
| Candidate Experience | The sum of perceptions and interactions a job seeker has with an employer throughout the recruitment process. |
| Conversion Rate (Hiring) | The percentage of candidates who move from one recruitment stage to the next, e.g., application to interview. |
| Time to Fill | The number of calendar days between a job requisition opening and a candidate accepting an offer. |
| Cost Per Hire | The total internal and external recruiting costs divided by the number of hires in a given period. |
Frequently Asked Questions
What is a good abandonment rate for recruiting?
A best-in-class abandonment rate falls between 15–20%. Most companies average around 92%, so anything below 60% signals a well-optimised application funnel.
Does mobile-first design lower application abandonment rates?
Yes. Mobile-optimised applications reduce abandonment by up to 40%, since over two-thirds of candidates begin job searches on smartphones or tablets.
How does resume parsing reduce application abandonment?
AI resume parsers auto-fill form fields from uploaded documents, cutting completion time from 15+ minutes to under 3 — eliminating the top candidate frustration.
Can abandoned applications still enter the talent pipeline?
Yes. Save-and-return functionality paired with automated email or SMS reminders can recover 15–20% of candidates who initially dropped off mid-application.
Does high abandonment rate hurt employer brand reputation?
Candidates who abandon broken applications are 3.5x more likely to leave negative employer reviews, making abandonment reduction an indirect brand protection strategy.
How does abandonment rate differ across career levels?
Executive and senior-level candidates tend to have lower abandonment rates because they’re typically more committed to specific roles. Entry-level and hourly positions see the highest abandonment, partly because those candidates apply to more roles simultaneously and have lower switching costs.
Can A/B testing help reduce abandonment rate?
Absolutely. Running A/B tests on application form length, field order, progress indicators, and CTA button copy can reveal what moves the needle for your specific candidate population. Even small changes, like moving a required field from step one to step three, can produce measurable drops in abandonment.
Is there such a thing as an abandonment rate that’s too low?
In theory, an extremely low abandonment rate could indicate that your application is so easy that it’s attracting a high volume of unqualified or low-intent applicants. The sweet spot is a rate that’s low enough to capture your target talent pool without letting through so much noise that your screening tools get overwhelmed. For most companies, 15–30% is the healthy range.
Conclusion
Abandonment rate is more than a funnel metric. It is a direct measure of how accessible your hiring process is to the talent market.
In AI-driven recruitment, where screening algorithms can only evaluate candidates who complete applications, every percentage point of abandonment represents lost potential. The fix is rarely complex: shorter forms, mobile optimisation, resume parsing, and save-and-return functionality address the majority of drop-offs.
Organisations that treat abandonment rate as a strategic KPI rather than a background statistic consistently build larger, more diverse, and higher-quality candidate pipelines without increasing their sourcing spend.