Most organizations track total recruitment spend, but far fewer understand their “unit cost”, what it actually costs to fill a single role. Without this, you can’t measure ROI or know if investments in Active Sourcing are actually paying off. Cost per hire (CPH) is the essential metric that turns a budget line into a performance indicator, calculated by dividing total recruiting costs by total hires.
In 2026, CPH is a standard reporting requirement for CFOs to judge if talent acquisition investment matches output. To get an accurate number, you must account for every touchpoint in the Candidate Journey, from the software fees for your Candidate Management System to the marketing spend on Branded Job Postings. A rigorous calculation is vital; a flawed one makes your strategy misleading.
By mastering CPH, you can prove where investment is generating returns and where it’s being absorbed without outcome, ensuring your Candidate Pipeline is built both effectively and efficiently.
The formula, standardized by the Society for Human Resource Management (SHRM) in collaboration with the American National Standards Institute (ANSI), is:
Cost Per Hire = (Total Internal Recruiting Costs + Total External Recruiting Costs) ÷ Total Number of Hires
Where internal costs include all internal TA function expenditures (recruiter salaries, benefits, overhead, technology) and external costs include all third-party expenditures (agency fees, job boards, background checks, assessments, career events, relocation).
What is Cost Per Hire?
Cost per hire is a recruiting efficiency metric that measures the average total investment required to make one hire, calculated by dividing the sum of all internal and external recruiting costs for a defined period by the total number of hires completed in that period, and used to evaluate the financial performance of the talent acquisition function over time and relative to industry benchmarks.
The metric exists in a specific analytical role within the TA dashboard: it measures input efficiency (how much does it cost to generate a hire?) rather than output quality (how good is the hire?). This distinction matters enormously. A low cost per hire achieved by cutting assessment investment, reducing recruiter capacity, or eliminating candidate experience improvements is not a good outcome. It is a different kind of expensive outcome, one where the cost shows up 12 months later as first-year attrition, performance issues, and replacement searches.
Cost per hire is most useful when it is tracked over time (to identify efficiency trends), segmented by role type (to identify where costs are disproportionate), compared against industry benchmarks (to assess competitive positioning), and analyzed alongside quality of hire metrics (to ensure that efficiency gains are not being achieved at the expense of hire quality).
Are You Measuring What Recruiting Actually Costs?
Most organizations undercount their cost per hire. Not deliberately, and not dramatically, but consistently, in ways that make the number look better than it is and that obscure the true economics of the hiring function.
The most common undercount is internal cost. Recruiter salaries are usually included. But the full-loaded cost of recruiter time, including benefits, payroll taxes, and a proportionate share of HR overhead, is frequently either estimated loosely or omitted. Hiring manager time, which is a real and often substantial cost of the hiring process, is almost never included. A hiring manager who spends 12 hours reviewing resumes, conducting interviews, and participating in debrief sessions for a single hire is contributing a cost to that hire, and that cost is typically invisible in the cost per hire calculation.
The second common undercount is technology. ATS licensing fees, talent intelligence platform subscriptions, and video interviewing tools are sometimes allocated to general IT or HR technology budgets rather than to the recruiting cost center, making them invisible in the cost per hire calculation even though they are genuine inputs to the hiring outcome.
The third common undercount is the amortization problem. Many recruiting investments are not per-hire expenditures. An employer brand campaign, a career site redesign, or a campus recruiting program produces benefit across multiple hiring cycles. If the full cost of these investments is attributed to the hires made in the year of the investment, the cost per hire for that year is overstated and subsequent years are understated. A more accurate approach is to amortize these investments across the expected period of benefit.
A 2025 SHRM benchmarking study found that organizations using the full ANSI/SHRM standard cost per hire methodology reported costs 34% higher than the same organizations’ previously self-reported figures. The gap was not new spending. It was existing spending that had not been counted.
For TA leaders, the implication is clear: a cost per hire number that has not been built on the full ANSI/SHRM methodology is an undercount. And an undercount, while it may look better in a board presentation, makes it impossible to have an accurate conversation about whether the TA function is appropriately resourced, where efficiency improvements are genuinely available, and whether investment in specific capabilities would generate positive returns.
The scenario that illustrates the decision-making gap most clearly: a TA director at a 500-person company is presenting to the CFO, reporting a cost per hire of $3,200. The CFO notes that the industry benchmark for similar-size companies in the sector is $4,800 and asks whether the company is underspending on recruiting. The TA director, not sure how to answer, defaults to calling it an efficiency win.
Six months later, time-to-fill has crept from 38 days to 54 days, hiring manager satisfaction scores have declined, and the company has lost three strong candidates to competitors who moved faster. The $3,200 cost per hire was not evidence of a well-run function. It was evidence of an underresourced one. And the undercount in the metric had made that invisible until the outcomes deteriorated enough to be undeniable.
Your Resume Isn’t Getting Read
Let’s Get That Fixed!
75% of resumes get auto-rejected. avua’s AI Resume Builder optimizes formatting, keywords, and scoring in under 3 minutes, so you land in the “yes” pile.
What Goes Into Cost Per Hire: The Full Calculation?
Internal Costs
Internal costs are all expenditures associated with the in-house recruiting function. The ANSI/SHRM standard includes the following categories:
- Recruiter and TA Staff Compensation: Full loaded cost of all internal recruiting personnel: base salary, variable compensation, benefits, payroll taxes, and any equity or retirement contributions. This should be allocated on a time-spent basis if recruiters are serving multiple functions.
- Hiring Manager and Interview Panel Time: The cost of time spent by non-recruiting employees on hiring activities: resume review, interview participation, debrief sessions, and offer discussions. This is calculated as the hourly fully-loaded cost of each employee’s time multiplied by the hours spent on recruiting activities per hire. Most organizations omit this entirely, which is the largest single undercount in typical cost per hire calculations.
- HR and Administrative Support: The cost of HR generalist, coordinator, and administrative time spent supporting the recruiting process: scheduling, onboarding paperwork, compliance administration, and background check coordination.
- Technology and Systems: The pro-rated cost of all technology directly supporting the recruiting function: ATS licensing, talent intelligence platforms, video interviewing tools, assessment platforms, HR analytics software, and any integrations or support costs.
- Office and Overhead: A proportionate share of facilities and overhead costs attributable to the recruiting function: office space, utilities, equipment, and any shared service allocations.
External Costs
External costs are all third-party expenditures made in connection with recruiting activity.
- Agency and Search Fees: All contingency placement fees, retained search fees, and staffing agency markups attributable to hires made in the period.
- Job Board and Advertising Costs: All paid job posting fees, sponsored content, and programmatic advertising spend across all platforms.
- Background Check and Assessment Fees: Per-candidate costs for background screening, drug testing, skills assessments, and psychometric evaluations.
- Career Events and Campus Recruiting: Sponsorship fees, travel costs, event materials, and staff time for career fairs, campus visits, and industry conferences.
- Employer Brand and Content: A pro-rated share of employer brand content production, career site development, and recruitment marketing campaign costs. These should be amortized across the expected useful life of the investment rather than fully expensed in the year of production.
- Relocation Costs: Any relocation assistance provided to candidates as a condition of hire.
- Referral Bonuses: All employee referral payments made in connection with hires completed in the period.
Cost Per Hire vs. Related Recruiting Metrics
| Metric | What It Measures | Best Used For | Primary Limitation |
|---|---|---|---|
| Cost Per Hire | Average total investment per hire | Overall TA efficiency benchmarking | Does not measure hire quality |
| Cost Per Qualified Applicant | Sourcing spend per qualified applicant generated | Sourcing channel efficiency | Does not account for downstream conversion |
| Source of Hire Cost | Recruiting spend attributed to each sourcing channel per hire | Channel ROI analysis | Attribution is complex when candidates use multiple touchpoints |
| Time-to-Fill | Days from requisition to offer acceptance | Process speed measurement | Does not measure quality or cost |
| Quality of Hire | Post-hire performance and retention | Long-term hire value | Lags the process; not actionable in real time |
| Cost Per Screened Candidate | Total spend per candidate advancing from application to screen | Application funnel efficiency | Intermediate metric; must be combined with downstream data |
The most important pairing in this table is cost per hire alongside quality of hire. Cost per hire measured in isolation can incentivize efficiency improvements that degrade hire quality: reducing assessment investment, eliminating employer brand activity, or cutting recruiter capacity all reduce cost per hire in the short term while increasing the downstream costs of poor-fit hires. The TA function that optimizes cost per hire without monitoring quality of hire is managing to the wrong metric.
What the Experts Say?
Cost per hire is one of those metrics that looks like a financial metric but is actually a strategic one. A low cost per hire in a competitive talent market is not necessarily good news. It might mean you are underspending on the capabilities that allow you to compete for the people you actually need.
– John Sullivan, Professor of Management at San Francisco State University and widely cited talent strategy advisor
How to Calculate Cost Per Hire Accurately?
The ANSI/SHRM Standard Formula
CPH = (Total Internal Costs + Total External Costs) ÷ Total Number of Hires
Segmented Cost Per Hire
Aggregate cost per hire is useful for benchmarking but obscures important variation. The more analytically valuable calculation segments by role type:
CPH by Role Type = (Internal Costs for Role + External Costs for Role) ÷ Number of Hires for Role
A company with an overall cost per hire of $4,200 may have a cost per hire of $2,100 for entry-level operations roles and $18,400 for senior technical roles. These two numbers require completely different management responses and cannot be meaningfully combined into a single organizational action.
Cost Per Hire by Sourcing Channel
CPH by Channel = (Channel Spend + Attributed Internal Cost) ÷ Hires from Channel
This calculation is the basis for sourcing channel ROI analysis and is the most actionable form of cost per hire analysis for sourcing strategy decisions.
Industry Benchmarks (2026 Data)
| Organization Size | Avg. Cost Per Hire | Internal Cost % | External Cost % |
|---|---|---|---|
| Under 100 employees | $5,200 | 31% | 69% |
| 100 to 999 employees | $4,700 | 44% | 56% |
| 1,000 to 9,999 employees | $4,100 | 58% | 42% |
| 10,000+ employees | $3,600 | 72% | 28% |
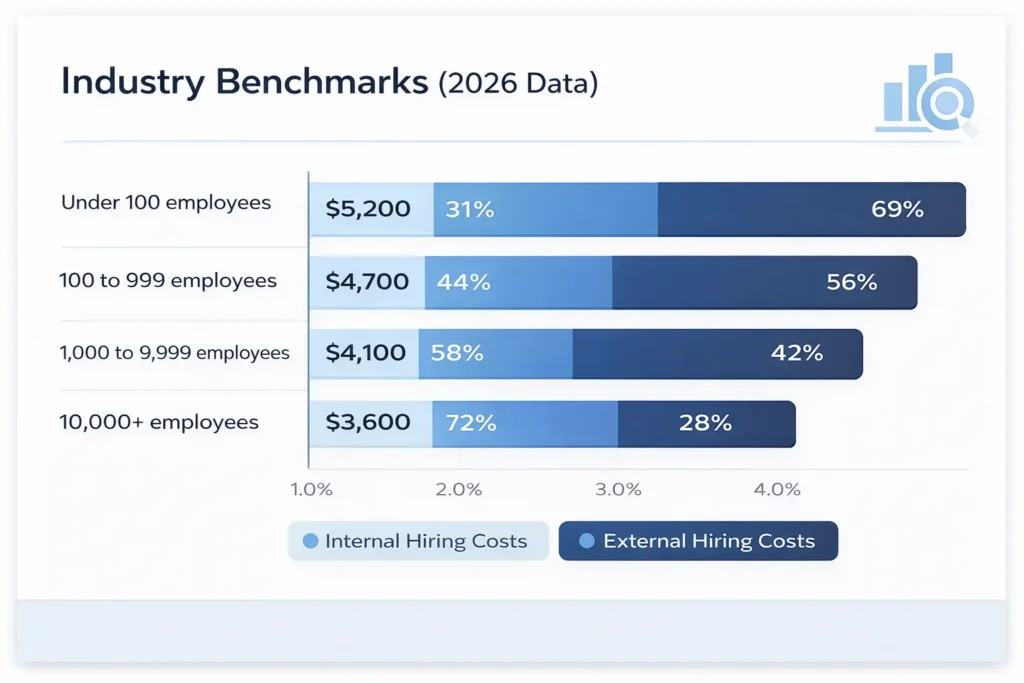
The pattern in this table reflects a fundamental dynamic: larger organizations have more internal recruiting infrastructure and proportionally higher internal costs, but their scale allows them to reduce reliance on external agency fees (the highest-cost external component) and to negotiate better rates on job boards and technology. Smaller organizations, with less internal capacity, rely more heavily on external vendors and pay proportionally higher external costs per hire.
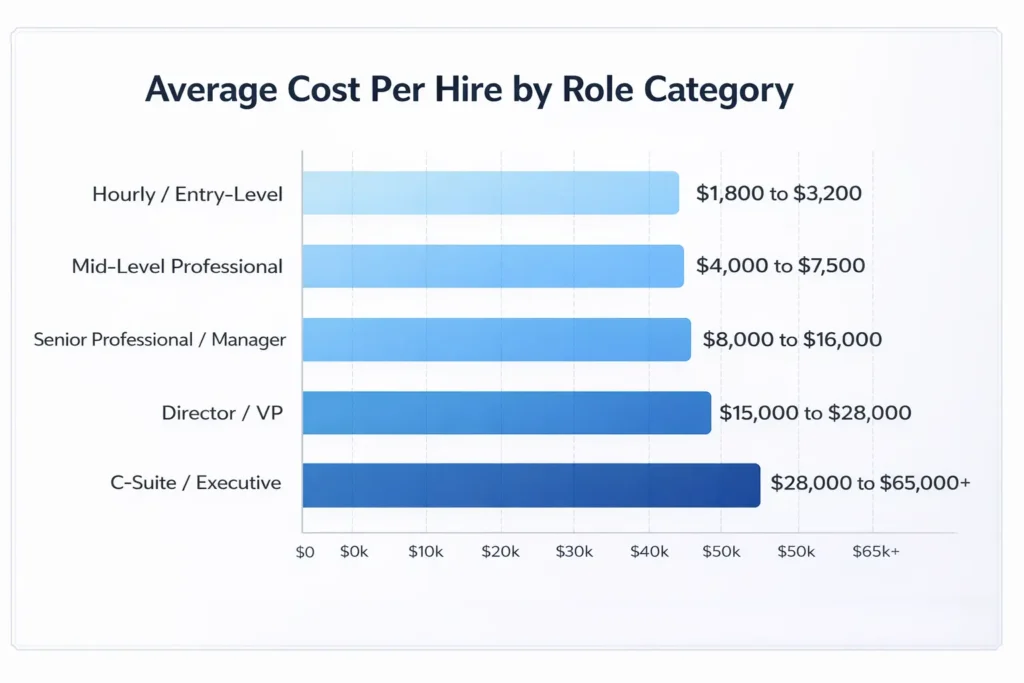
| Role Category | Avg. Cost Per Hire |
|---|---|
| Hourly / Entry-Level | $1,800 to $3,200 |
| Mid-Level Professional | $4,000 to $7,500 |
| Senior Professional / Manager | $8,000 to $16,000 |
| Director / VP | $15,000 to $28,000 |
| C-Suite / Executive | $28,000 to $65,000+ |
Key Strategies for Managing Cost Per Hire
How AI Is Reducing Cost Per Hire?
Automated Screening and Initial Assessment
AI-powered screening tools that evaluate applications against structured role criteria and present ranked candidate lists to recruiters can process application volumes that would require multiple additional recruiter headcount to manage manually. The cost of these tools, amortized across the hires they support, typically produces a meaningful reduction in cost per screened candidate and a reduction in the recruiter time component of internal cost per hire.
Programmatic Job Advertising
Programmatic advertising platforms that use performance data to dynamically allocate job advertising spend toward the platforms, geographies, and audiences that are producing the best application-to-hire conversion rates consistently deliver lower cost per application and lower cost per hire from paid advertising channels compared to manual spend allocation.
Candidate Rediscovery
AI-powered ATS search tools that surface previously interviewed or screened candidates who are now suitable for new openings reduce the need for full sourcing campaigns for every open role. A rediscovered candidate who has already been through part of the assessment process represents a substantially lower cost-to-hire than a candidate sourced from scratch.
Interview Scheduling Automation
Recruiter coordinator time spent on interview scheduling is a low-value activity that is highly automatable. Scheduling tools that allow candidates to self-schedule within the hiring team’s calendar availability reduce coordinator time costs and eliminate the scheduling lag that extends time-in-stage and increases dropout rates.
Stop Juggling
10 Job Boards.
Search One
Your next role is already here. avua pulls opportunities from across the web into a single searchable feed; filtered by role, location, salary, and remote preference.
1.5 Million+
Active Jobs
380+
Job Categories
Cost Per Hire and Diversity, Equity, and Inclusion
The relationship between cost per hire and DEI hiring goals is nuanced and worth addressing directly.
Higher Short-Term Costs Are Sometimes Appropriate
Building a more diverse candidate pipeline often requires investment in sourcing channels, community partnerships, and outreach programs that reach candidate populations not well-represented in the standard sourcing mix. These investments typically increase cost per hire in the short term. Organizations that set a constraint of maintaining or reducing cost per hire while pursuing diversity hiring goals are implicitly choosing cost efficiency over pipeline diversification, which is a trade-off worth making explicitly rather than accidentally.
Structured Assessment Reduces Bias and May Reduce Long-Term Cost
Investments in structured assessment tools, including competency-based interview frameworks, standardized rubrics, and bias mitigation training, are often categorized as cost per hire increases. In practice, they tend to reduce the downstream costs associated with poor-fit hires, reduce legal and reputational risk, and improve first-year retention rates among diverse hires specifically, because structured assessment is more reliably equitable than unstructured evaluation.
Tracking Cost Per Hire by Demographic Segment
Organizations with mature TA analytics capabilities should track cost per hire by candidate demographic segment to identify whether the process is generating disproportionate costs for specific groups. Significantly higher costs per hire for candidates from underrepresented backgrounds may indicate that the process is creating additional friction or requiring more touchpoints before offers are extended, both of which are worth investigating.
Common Challenges and Solutions
| Challenge | Solution |
|---|---|
| Inconsistent Cost Inclusion Across Business Units | Adopt the ANSI/SHRM standard methodology organization-wide and conduct an annual cost audit to ensure consistent inclusion of all cost categories |
| Hiring Manager Time Not Captured | Implement time-tracking for hiring activities or use role-level salary data to estimate time cost; even approximate inclusion is better than omission |
| Technology Costs in Wrong Budget | Work with finance to reallocate TA technology line items to the recruiting cost center or establish a formal cost-share methodology |
| Cost Per Hire Increasing Without Explanation | Segment by role type and sourcing channel to identify where the increase is concentrated; rising agency fee dependency is the most common culprit |
| Low Cost Per Hire Masking Quality Problems | Always track cost per hire alongside first-year attrition and hiring manager satisfaction; efficiency gains that degrade hire quality are false economies |
Real-World Case Studies
Case Study 1: The Professional Services Firm
A 1,200-person professional services firm had been reporting a cost per hire of $3,800 for three years. The figure appeared stable and below the industry benchmark of $4,700 for their size segment, which was presented to leadership as evidence of a well-run TA function.
A methodology audit against the ANSI/SHRM standard revealed that the $3,800 figure excluded: hiring manager interview time (estimated at $680 per hire when calculated from time logs and salary data), a pro-rated share of the firm’s ATS licensing ($190 per hire), and the full cost of the employer brand campaign launched 18 months prior that had been fully expensed in the year of launch rather than amortized ($310 per hire on a three-year amortization basis).
Corrected cost per hire: $4,980, 6% above the industry benchmark rather than 19% below it. The TA director used the corrected figure not to alarm leadership but to open a constructive conversation about where the function was underresourced relative to peers and what investment would generate measurable returns in time-to-fill and quality of hire.
Case Study 2: The Technology Company
A 300-person technology company was experiencing rapid growth and increasing its hiring volume from 45 to 120 hires per year. Cost per hire was running at $6,200, driven heavily by contingency agency fees that were funding 58% of all placements. The TA team consisted of two recruiters.
A build-versus-buy analysis showed that hiring two additional internal recruiters, investing in a talent intelligence platform, and implementing a structured employee referral program would require a first-year investment of approximately $380,000 but would reduce agency fee dependency from 58% to an estimated 22% of placements within 18 months. The projected cost per hire after the transition: $3,900, a 37% reduction from the baseline, with a payback period of approximately 14 months on the infrastructure investment.
The company made the investment. In the second year after implementation, cost per hire for the 120-hire cohort was $4,100 (slightly above projection due to a competitive market for engineering talent), agency fee dependency had dropped to 24%, and the employee referral program was funding 31% of hires at a per-referral bonus cost of $2,500 versus the $22,000 average agency fee for equivalent roles.
Case Study 3: The Retail Organization
A national retailer with 8,000 hourly employees and high annual turnover was generating a reported cost per hire of $1,400 for frontline roles. Finance considered this acceptable for the role level and was not prioritizing investment in the hourly hiring process.
A full methodology review revealed that the $1,400 figure excluded the cost of store manager time spent interviewing (estimated at $420 per hire based on manager compensation and time-per-interview data), the turnover-driven replacement cycle cost (the 52% first-year attrition rate meant the company was effectively paying the cost per hire 1.52 times per position per year), and the lost productivity during the vacancy period between departure and fill (estimated at $610 per vacancy day across the role type).
True annual cost of hourly recruiting, inclusive of all these factors: approximately $4.8 million against the reported $2.3 million. The additional $2.5 million was being absorbed in operations and store management budgets rather than appearing in the TA cost center. The full-cost analysis justified investment in a dedicated hourly TA coordinator role, a simplified mobile application process, and an onboarding experience redesign targeted at improving 30-day retention. These investments reduced first-year attrition from 52% to 38% within 12 months, producing an estimated $890,000 in annual savings against a $210,000 investment.
Building a Cost Per Hire Dashboard: What to Track?
Cost Per Hire Across the Hiring Lifecycle
Workforce Planning
Cost per hire data is a direct input to workforce planning financial modeling. The projected hiring volume for the coming year, multiplied by the role-level cost per hire, produces the TA budget requirement. Organizations that do not have accurate cost per hire data by role level consistently either over- or under-budget for talent acquisition, with predictable consequences for hiring capacity.
Sourcing Strategy
Channel-level cost per hire analysis is the primary input to sourcing strategy: which channels to invest in, which to reduce, and where the marginal return on additional sourcing spend is highest. This analysis should be conducted at least annually and used to drive sourcing budget allocation decisions.
Build vs. Buy Decisions
Every significant TA investment decision, whether to add internal recruiter headcount, build a new employer brand program, invest in a new assessment technology, or establish a campus recruiting program, should be evaluated in terms of its projected impact on cost per hire alongside its projected impact on time-to-fill and quality of hire.
The Real Cost of Undercounting: By the Numbers
| Cost Category | Typically Included | Typically Omitted | Omission Impact on CPH |
|---|---|---|---|
| Recruiter Salaries | Yes | Rarely benefits/overhead | Understates by $400 to $800 |
| Hiring Manager Time | Rarely | Almost always | Understates by $600 to $1,400 |
| Technology (ATS, tools) | Sometimes | Often | Understates by $150 to $350 |
| Employer Brand (amortized) | Rarely | Almost always | Understates by $200 to $500 |
| Referral Bonuses | Usually | Sometimes | Understates by $100 to $300 |
| Total Undercount Range | $1,450 to $3,350 per hire |
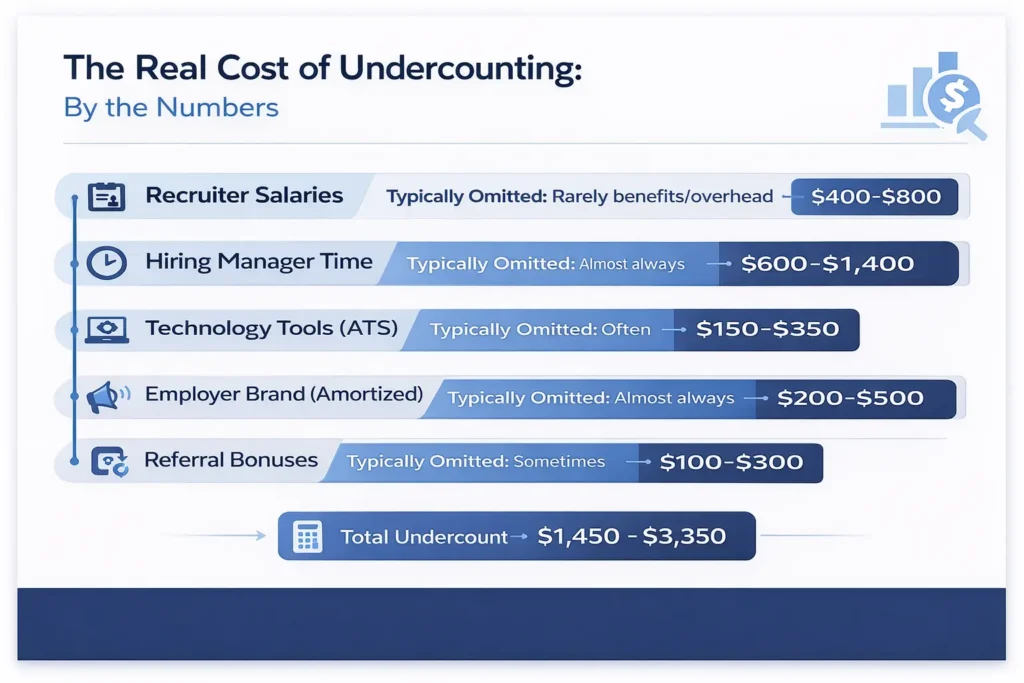
For an organization making 200 hires per year, a systematic undercount of $2,000 per hire represents $400,000 in untracked recruiting investment that is funding hiring outcomes without appearing in the TA cost center. This is not a rounding error. It is a strategic blind spot.
Related Terms
| Term | Definition |
|---|---|
| Quality of Hire | A measure of the value a new hire delivers to the organization, typically assessed through performance ratings and retention; the output metric that cost per hire should always be evaluated alongside |
| Time-to-Fill | The elapsed time from requisition opening to offer acceptance; related to cost per hire in that longer fill times increase internal cost per hire through recruiter time and manager opportunity cost |
| Source of Hire | The channel or method through which a hired candidate first entered the organization’s pipeline; the basis for channel-level cost per hire analysis |
| Employee Referral Rate | The proportion of hires sourced through employee referral programs; the sourcing channel with the consistently lowest cost per hire across most role types |
| Agency Fee | A contingency or retained search fee paid to an external recruiting firm on successful placement; the highest-cost external component in most organizations’ cost per hire calculations |
| ANSI/SHRM Standard | The industry-standard methodology for calculating cost per hire, developed jointly by the American National Standards Institute and the Society for Human Resource Management |
Frequently Asked Questions
What is the average cost per hire in 2026?
The SHRM 2026 benchmark puts average cost per hire at approximately $4,700 across US organizations. This varies significantly by industry, organization size, and role level. Technology and financial services run above average; retail and hospitality below. Executive hires cost 10 to 15 times more than entry-level roles. The most relevant benchmark is always one specific to your industry, size, and role mix.
Should cost per hire include the cost of unsuccessful searches?
Yes, under the ANSI/SHRM standard. All recruiting costs in a period are divided by all hires made in that same period, including the cost of unsuccessful searches. Excluding those costs systematically understates the true cost per hire.
How does cost per hire relate to return on investment for recruiting?
Cost per hire is the investment side of the equation; quality of hire is the return side. A hire at $8,000 who delivers strong performance over five years has a very different ROI than a $4,000 hire who underperforms and exits within a year. Cost per hire should never be tracked in isolation from quality data.
How often should cost per hire be calculated?
Monthly tracking with quarterly and annual review is standard for organizations hiring 50-plus per year. Smaller organizations can manage with quarterly calculation. Annual benchmarking against industry data should align with the budgeting cycle so cost per hire insights can inform the following year’s TA investment.
Can cost per hire be too low?
Yes. A cost per hire well below benchmark is worth investigating, not just celebrating. It may reflect genuine sourcing efficiency, but it can also indicate underinvestment in assessment quality, employer brand, or recruiter capacity. Those gaps do not show up in cost per hire but do show up in hire quality, vacancy length, and replacement frequency.
Conclusion
Calculating cost per hire isn’t rocket science, but it does require immense discipline. While the formula is straightforward, its real value lies in the integrity of the data. An accurate, consistent number allows for budget justification and smarter decisions on whether to ramp up Active Sourcing or lean more heavily on AI Hiring tools to drive efficiency.
Complexity arises when you track every cost across the Candidate Journey without omitting the “hidden” expenses. Interestingly, rigorous tracking often reveals that a low cost per hire isn’t always a win. Some organizations discover that underspending on their Candidate Pipeline actually leads to a spiked Attrition Rate later on.
This isn’t bad news, it’s a strategic breakthrough. It provides the data needed to have a productive conversation with the CFO, proving that talent acquisition is a value-driver rather than just a cost center. By resisting the temptation to report the “comfortable” version of the number, TA leaders can justify the investments necessary to find the right talent.
Ultimately, cost per hire only works as a performance indicator if the number is real.