Most organizations track engagement scores but treat them as a static outcome rather than a vital signal. A high score doesn’t just mean people are “satisfied”, satisfaction is about comfort, whereas true engagement is about investment. While a satisfied employee might stay for the perks, an engaged one drives the performance and advocacy that fuels your Candidate Pipeline.
This distinction is critical for the overall Candidate Experience. Engaged employees act as your most authentic brand ambassadors, turning a standard Branded Job Posting into a compelling invitation. Conversely, disengaged teams lead to a spiked Attrition Rate, undoing the hard work of even the most sophisticated recruitment strategy.
When engagement is high, the organization becomes a magnet for talent, often seeing the return of a Boomerang Employee or a steady flow of high-quality referrals. It transforms the Candidate Journey from a corporate process into a genuine human connection. Ultimately, engagement isn’t just an internal HR metric; it’s a talent acquisition engine that determines whether your organization is a place where an Active Candidate actually wants to build a career.
The foundational engagement metric is the Employee Engagement Index (EEI): a composite score across three validated dimensions.
EEI = (Advocacy + Retention Intent + Discretionary Effort) ÷ 3
Each dimension is measured on a standardized scale and averaged to produce a composite index. Industry benchmarks cluster between 55 and 70 on a 100-point scale for the overall EEI. Scores above 70 indicate a highly engaged workforce; scores below 50 indicate significant disengagement risk across the organization.
What is Employee Engagement?
Employee engagement is a multidimensional state of psychological and behavioral investment in one’s work and organization, characterized by vigor (energy and resilience at work), dedication (sense of significance, enthusiasm, and pride in one’s work), and absorption (concentration and immersion in work activities), and sustained by organizational conditions that meet employees’ needs for autonomy, competence, and relatedness.
The three-component engagement model (vigor, dedication, absorption) comes from academic research by Schaufeli and colleagues and provides a more nuanced framework than the colloquial understanding of engagement as “employees who care about their jobs.” Employees can be vigorous without being dedicated. They can be dedicated without being absorbed. The full engagement state, all three components present simultaneously, is what produces the performance and retention outcomes that engagement programs are designed to generate.
Engagement is also a dynamic state, not a fixed trait. The same employee can be highly engaged in one organizational context and disengaged in another, depending on the quality of their manager relationship, the meaningfulness of their current work, the clarity of their growth path, and the degree to which they feel psychologically safe to contribute fully.
Is Your Engagement Program Measuring Engagement or Measuring Satisfaction With the Status Quo?
Most annual engagement surveys measure satisfaction. They ask whether employees are happy with their compensation, whether they find their work interesting, whether they feel recognized, and whether they trust senior leadership. These are useful data points. They are not measures of engagement.
Satisfaction is about what the organization provides. Engagement is about what the employee brings. The distinction matters because organizations that optimize for satisfaction, providing better benefits, more flexible schedules, nicer offices, can improve their satisfaction scores without improving engagement at all. Meanwhile, their most capable employees, who are engaged not by perks but by meaningful work, strong management, and genuine growth, may be leaving precisely because the organization is investing in the wrong variables.
The leading engagement research, particularly the extensive body of work from Gallup’s Q12 framework and the academic work on self-determination theory, consistently identifies the same small set of factors as the most powerful predictors of genuine engagement: clarity about what is expected, the opportunity to do what one does best every day, the presence of a manager who cares about development, the sense that work matters, and the existence of collegial relationships. These factors are management and culture conditions, not compensation or benefits variables.
Organizations in the top quartile for employee engagement outperform those in the bottom quartile by 23% in profitability, 18% in productivity, and 43% in turnover reduction. These are not marginal differences. They represent the compounding effect of a workforce that is investing discretionary effort rather than performing minimum requirements, that is staying long enough to build expertise, and that is contributing to the organizational knowledge base rather than taking it with them to a competitor.
The scenario that makes the distinction concrete: two teams at a consulting firm have identical satisfaction scores on the annual survey, both rating 4.1 out of 5.0 on the overall question. One team’s manager holds weekly one-on-ones that are genuinely developmental, gives team members stretch assignments with clear feedback, and advocates for their work to senior leadership. The other team’s manager conducts monthly check-ins that cover project status, provides feedback primarily when something goes wrong, and rarely discusses career development outside of annual review cycles.
The first team produces 34% more billable output, has zero voluntary departures in the 12-month period, and generates three internal referrals for open roles. The second team produces output at target, loses two of five members to external opportunities, and produces no referrals. The satisfaction survey did not detect this difference. An engagement measurement that specifically assessed manager quality, growth opportunity, and work meaningfulness would have.
Your Resume Isn’t Getting Read
Let’s Get That Fixed!
75% of resumes get auto-rejected. avua’s AI Resume Builder optimizes formatting, keywords, and scoring in under 3 minutes, so you land in the “yes” pile.
Common Misconceptions About Employee Engagement
| Misconception | Reality |
|---|---|
| “Engagement is just job satisfaction.” | Satisfaction measures contentment with conditions. Engagement measures investment and discretionary effort. High satisfaction with low engagement is common and represents a significant performance risk. |
| “Annual surveys are sufficient to measure engagement.” | Annual surveys capture a point-in-time snapshot that is outdated by the time it is analyzed. Engagement is dynamic; meaningful measurement requires more frequent pulse data connected to action. |
| “Perks and benefits are the primary engagement drivers.” | Research consistently shows that compensation and benefits account for less than 20% of engagement variance. Manager quality, work meaningfulness, and growth opportunity are the dominant drivers. |
| “High engagement means employees will never leave.” | Engaged employees still leave when growth opportunities are exhausted, when life circumstances change, or when a significantly better-aligned opportunity arises. Engagement reduces preventable attrition; it does not eliminate all attrition. |
| “Engagement programs are an HR responsibility.” | The primary drivers of engagement, manager quality, work design, and growth opportunity, are line management responsibilities. HR can design the measurement system and provide coaching frameworks; the actual engagement work happens in manager-employee relationships. |
| “Our low engagement score means employees are unhappy.” | Low engagement scores can reflect unclear expectations, poor role fit, or growth stagnation without the employee being unhappy. Diagnosing what is driving the score requires qualitative data alongside the quantitative measure. |
The Four Drivers of Engagement: What Research Consistently Supports
Decades of engagement research across industries and geographies has produced a consistently identified set of drivers. These are not the only factors that affect engagement, but they are the ones that explain the most variance in engagement outcomes and that are most actionable at the organizational level.
Driver 1: Manager Quality
The quality of the direct manager relationship is the single most powerful predictor of individual engagement, accounting for approximately 70% of the variance in team engagement scores in Gallup’s research. A manager who provides clear expectations, meaningful feedback, development support, and genuine care for the employee as a person produces engagement that compensation, perks, and culture programs cannot replicate. An organization with a strong average engagement score but significant variance across teams has a manager quality problem, not a program gap.
Driver 2: Work Meaningfulness
Employees who believe their work matters, both to the organization’s purpose and to people they care about, demonstrate significantly higher engagement than those who see their work as a set of tasks without clear significance. Work meaningfulness is not purely intrinsic to specific types of roles: it is a function of how work is framed, what context is provided about its impact, and whether employees have direct visibility into the outcomes their efforts produce.
Driver 3: Growth Opportunity
Employees who can see a clear development path, who are given stretch assignments, and who feel they are becoming more capable over time demonstrate higher engagement and significantly better retention than those whose role scope is static. Growth opportunity does not require promotion: lateral development, skill expansion, and increasing scope of impact within a current role all satisfy the growth driver when they are genuine and visible.
Driver 4: Psychological Safety
Employees who feel safe to share ideas, raise concerns, and make mistakes without fear of punishment demonstrate higher engagement and contribute more to team and organizational performance than those operating in environments where voicing concerns carries social risk. Psychological safety, documented extensively in Google’s Project Aristotle research as the strongest predictor of team effectiveness, is also one of the strongest engagement drivers at the individual level.
Employee Engagement vs. Related Concepts
| Concept | Definition | Key Difference from Engagement |
|---|---|---|
| Employee Satisfaction | Contentment with job conditions and organizational provisions | Satisfaction is passive (received); engagement is active (invested) |
| Employee Happiness | Positive emotional state at work | Happiness is transient and affective; engagement is sustained and behavioral |
| Employee Motivation | Drive to direct effort toward a goal | Motivation describes direction of effort; engagement describes investment and connection |
| Employee Experience | The holistic perception of one’s interactions with the organization | Experience is the context; engagement is the response to that context |
| Employee Commitment | Loyalty and intent to remain with the organization | Commitment is the retention dimension of engagement; full engagement also includes performance and advocacy |
| Discretionary Effort | Effort beyond minimum role requirements | Discretionary effort is the behavioral output of engagement; engagement is the psychological state that produces it |
What the Experts Say?
Engagement is not something you give people. It is something that happens when the conditions are right: when people know what is expected of them, when they have the tools and relationships to do their work well, when they can see that what they do matters, and when someone who knows them is invested in their growth. Create those conditions consistently and engagement follows. Neglect them and no program will substitute.
– Jim Harter, Chief Scientist of Workplace Management and Wellbeing
How to Measure Engagement Effectively?
The Three-Component EEI Model
The most diagnostic approach to engagement measurement assesses the three behavioral dimensions independently before aggregating:
Say (Advocacy)
Would this employee recommend the organization as a place to work? Would they recommend its products or services? Do they speak positively about the organization to colleagues, friends, and professional contacts?
Stay (Retention Intent)
Does this employee intend to remain with the organization for the next 12 months? Do they see their long-term career within the organization? Are they actively or passively searching for external opportunities?
Strive (Discretionary Effort)
Is this employee giving more than the minimum required by their role? Are they proactively improving their work, supporting colleagues beyond their formal responsibilities, and contributing to organizational improvement?
An employee who scores high on all three dimensions is genuinely engaged. An employee who scores high on Stay but low on Strive is retained but disengaged, a common and costly pattern. An employee who scores high on Say but low on Stay is an ambassador but a flight risk.
Pulse Surveys vs. Annual Surveys
Annual engagement surveys provide a single snapshot that is typically outdated by the time it reaches leaders who can act on it. Quarterly pulse surveys of 5 to 8 targeted questions provide more timely, more actionable data. The optimal cadence depends on organizational size and the rate of change in the organizational environment, but any organization that acts on engagement data only once per year is managing a dynamic state with a static measurement.
Manager-Level Reporting
Engagement data reported only at the organizational level obscures the manager quality variance that is the primary driver of engagement differences. Reporting at the team and manager level, with sufficient sample size protections for small teams, is what enables the targeted coaching and development interventions that actually improve engagement.
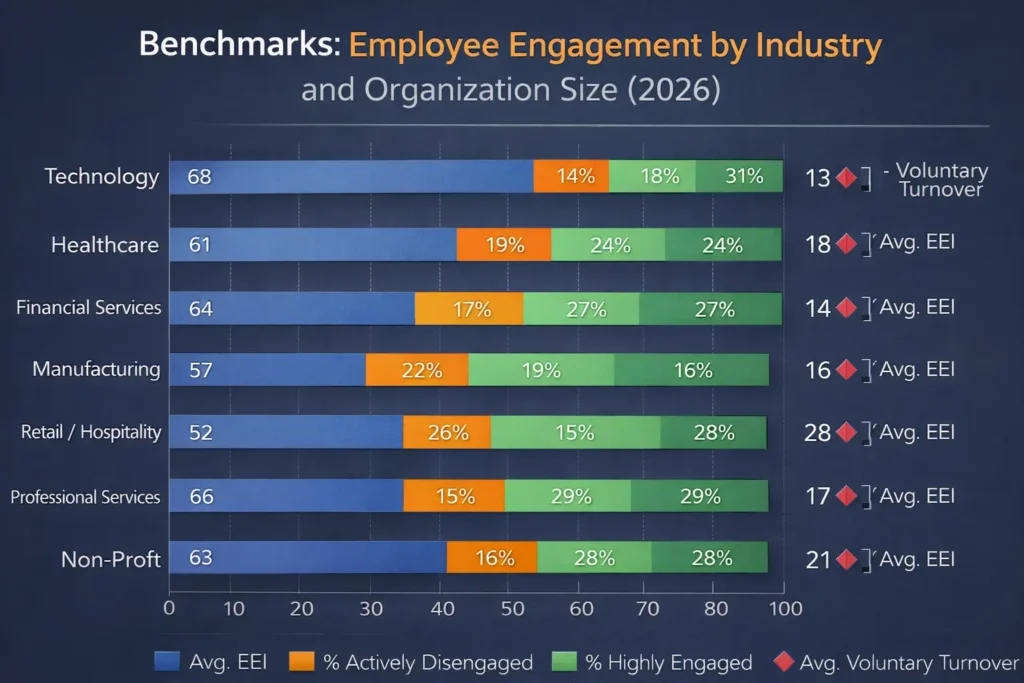
Benchmarks: Employee Engagement by Industry and Organization Size (2026)
| Segment | Avg. EEI | % Actively Disengaged | % Highly Engaged | Avg. Voluntary Turnover |
|---|---|---|---|---|
| Technology | 68 | 14% | 31% | 13% |
| Healthcare | 61 | 19% | 24% | 18% |
| Financial Services | 64 | 17% | 27% | 14% |
| Manufacturing | 57 | 22% | 19% | 16% |
| Retail / Hospitality | 52 | 26% | 15% | 28% |
| Professional Services | 66 | 15% | 29% | 17% |
| Non-Profit | 63 | 16% | 28% | 21% |
| Organization Size | Avg. EEI | Primary Engagement Driver | Most Common Gap |
|---|---|---|---|
| Under 100 employees | 71 | Founder/leadership visibility and relationship | Role clarity as the org scales |
| 100 to 999 employees | 65 | Manager quality and team culture | Middle manager development |
| 1,000 to 9,999 employees | 61 | Career development and growth pathways | Cross-functional visibility |
| 10,000+ employees | 58 | Organizational purpose and senior leadership trust | Connection to meaningful impact |
Key Strategies for Improving Employee Engagement
Quick-Reference Cheat Sheet: Employee Engagement
Key Formulas
EEI = (Say + Stay + Strive) ÷ 3
Cost of Disengagement (annual) = Headcount × Average Salary × 0.34
(Gallup estimates disengaged employees cost 34% of their salary in lost productivity)
The Four Primary Engagement Drivers (in order of impact):
- Manager quality and relationship
- Work meaningfulness and purpose
- Growth and development opportunity
- Psychological safety and voice
EEI Benchmark Ranges:
- Below 50: Critical disengagement risk
- 50 to 60: Below average; intervention required
- 60 to 70: Average range; improvement opportunity significant
- 70 to 80: Above average; sustain and optimize
- Above 80: Best-in-class; focus on retention of highly engaged population
Dos and Don’ts:
| Do | Don’t |
|---|---|
| Measure engagement at team and manager level | Report only organizational averages |
| Use pulse surveys quarterly | Rely on annual surveys as the only data source |
| Act visibly on survey findings within 60 days | Conduct surveys without committing to action |
| Develop managers as the primary lever | Substitute perks and benefits for management quality |
| Connect engagement data to business outcomes | Treat engagement as a standalone HR metric |
| Separate satisfaction from engagement in measurement | Use satisfaction surveys as engagement proxies |
How AI Is Transforming Employee Engagement?
Real-Time Engagement Signal Detection
AI tools that analyze communication patterns, meeting participation, collaboration network data, and system usage can identify engagement signal changes, including early indicators of disengagement, before they appear in survey data. These passive listening tools complement survey-based measurement by providing continuous signals rather than periodic snapshots.
Personalized Development Recommendations
AI-powered career development platforms can analyze individual engagement patterns, skill gaps, and growth preferences to generate personalized development recommendations that address the growth opportunity driver of engagement at scale. Rather than providing the same development resources to all employees, these tools direct development investment toward the specific gaps and interests most likely to improve individual engagement.
Manager Effectiveness Analytics
AI analysis of manager behavior patterns, including meeting frequency and quality, feedback patterns, recognition activity, and team output trends, can identify managers whose behavior patterns correlate with low team engagement before survey data confirms the problem. This early identification enables coaching interventions before engaged team members become flight risks.
Stop Juggling
10 Job Boards.
Search One
Your next role is already here. avua pulls opportunities from across the web into a single searchable feed; filtered by role, location, salary, and remote preference.
1.5 Million+
Active Jobs
380+
Job Categories
Employee Engagement and Talent Acquisition
Employee engagement is not typically managed by the talent acquisition function, but its impact on talent acquisition outcomes is substantial and underappreciated.
Referral Quality and Volume
Highly engaged employees refer candidates at 2.4 times the rate of disengaged employees, and their referrals convert to hires at higher rates and show better 24-month retention. An organization’s referral program effectiveness is a direct function of its engagement level.
Employer Brand Authenticity
The employee content that builds the most credible talent brand is produced by engaged employees who have genuine positive experiences to share. Organizations with low engagement cannot produce authentic positive employer brand content, because their employees do not have authentic positive experiences to communicate.
Offer Acceptance Rate
Candidates who interact with engaged employees during the interview process, and who conduct external research encountering engaged employees’ positive content, accept offers at higher rates than those who encounter neutral or negative employee signals. The offer acceptance rate is partially a compensation variable and partially an engagement variable.
Time-to-Fill
Engaged organizations attract more proactive inbound applications and generate stronger referral pipelines, both of which reduce time-to-fill for open roles. The relationship between engagement and recruiting efficiency is real and measurable but rarely tracked by TA functions.
Common Challenges and Solutions
| Challenge | Solution |
|---|---|
| Survey fatigue reducing response rates | Reduce survey length; increase action visibility; explain how data is used before each survey cycle |
| Manager resistance to team-level reporting | Frame team data as a coaching tool rather than performance evaluation; provide manager development support alongside data |
| Engagement improving in surveys but not in behavior | Audit whether survey questions are measuring engagement or satisfaction; validate survey instrument against behavioral outcomes |
| Senior leadership not acting on engagement findings | Present engagement data alongside business outcome data (turnover cost, productivity); connect to P&L in the language of the CFO |
| Engagement investment seen as soft HR spend | Calculate the cost of current disengagement (Gallup formula); compare against the investment required to address the primary drivers |
Real-World Case Studies
Case Study 1: The Technology Company
A 900-person technology company had an overall engagement score of 63, slightly below industry average. Leadership treated this as acceptable and had no targeted engagement program. An analysis connecting engagement data to business outcomes revealed the cost of the indifference: the 19% of employees classified as actively disengaged were costing an estimated $3.4 million annually in lost productivity, and the company was experiencing 24% voluntary turnover against an industry average of 13%.
A targeted manager development program, based on the finding that teams whose managers scored below a defined threshold on the engagement driver questions showed 3x the voluntary turnover of high-manager-quality teams, trained 34 mid-level managers in the specific engagement behaviors associated with high team scores. Within 12 months, EEI improved from 63 to 71. Voluntary turnover declined from 24% to 16%, saving an estimated $1.8 million in replacement costs against a program investment of $280,000.
Case Study 2: The Healthcare Network
A regional healthcare network was using annual engagement surveys producing overall scores in the 58 to 61 range across four years. The scores were never acted on because leadership did not know which specific issues to address.
A redesign of the measurement program introduced quarterly pulse surveys measuring the four primary engagement drivers separately at the team level, with manager-specific reporting. The first quarter’s data revealed that two specific drivers, growth opportunity (score: 42) and psychological safety (score: 44), were significantly below the other two drivers and well below benchmark. Three departments showed dramatically lower psychological safety scores than the rest of the organization.
Targeted interventions in the three low-scoring departments, focused on manager coaching in feedback and candor culture, produced measurable improvement in those departments’ pulse scores within two quarters. Organization-wide growth opportunity improvement, through a structured internal mobility program, improved the growth driver score from 42 to 58 over 18 months. First-year nursing retention improved from 67% to 78% over the same period, a direct outcome traceable to the engagement improvement.
Case Study 3: The Professional Services Firm
A professional services firm was investing $340,000 annually in employee engagement programs: team events, recognition awards, wellness benefits, and an annual engagement survey. EEI was 62. A cost-effectiveness analysis revealed that the primary engagement driver gap was manager quality (scoring 48 against a benchmark of 65), but the engagement program budget was allocated almost entirely to events and benefits, with less than $12,000 invested in manager development.
A budget reallocation shifted $180,000 from events and benefits toward manager effectiveness programs: structured coaching for all people managers, a 360 feedback process connected to manager development plans, and a manager quality metric included in promotion criteria. Within 18 months, the manager quality driver score improved from 48 to 63. EEI improved from 62 to 71. Voluntary turnover declined 19%. The events and benefits budget reduction was not detected in satisfaction scores, confirming that those investments were not primary engagement drivers.
Building an Employee Engagement Dashboard: What to Track?
Employee Engagement Across the Talent Lifecycle
Talent Acquisition
Engagement affects talent acquisition through referral volume, employer brand authenticity, offer acceptance rates, and time-to-fill. Organizations that measure engagement only as a post-hire HR metric are missing its most direct financial connection: the pipeline advantage that high engagement produces for the recruiting function.
Onboarding
The first 90 days are the period of highest engagement formation: the initial impressions of management quality, work meaningfulness, and team culture established in onboarding have disproportionate influence on the employee’s engagement trajectory. Onboarding programs designed to accelerate engagement driver connection, specifically connecting new employees to the purpose of their work and establishing strong manager relationships early, produce better 12-month engagement and retention outcomes than compliance-focused onboarding.
Development and Performance
The growth opportunity driver, the second most powerful engagement predictor, is primarily addressed through performance management and development systems. Organizations whose performance management systems are primarily evaluative rather than developmental consistently show lower engagement on the growth driver, regardless of how strong their other engagement conditions are.
Retention and Transition
Engagement measurement is one of the most reliable leading indicators of voluntary turnover available to organizations. Declines in engagement scores, particularly on the Stay dimension, at the team level typically precede voluntary departures by 60 to 90 days, providing a window for retention intervention before decisions are made.
Related Terms
| Term | Definition |
|---|---|
| Employee Experience | The holistic perception of an employee’s interactions with the organization across the entire employment lifecycle; the context within which engagement is formed |
| eNPS (Employee Net Promoter Score) | A standardized measure of the proportion of employees who would recommend the organization as a place to work; the advocacy component of the EEI |
| Discretionary Effort | Effort beyond the minimum required by a role; the primary behavioral output of employee engagement |
| Psychological Safety | The belief that one can speak up, take risks, and make mistakes without fear of punishment; one of the four primary engagement drivers |
| Manager Effectiveness | The quality of a manager’s leadership behaviors relative to engagement outcomes; the strongest predictor of team-level engagement |
| Voluntary Turnover | Employee-initiated departures from the organization; the most directly measurable consequence of engagement decline |
Frequently Asked Questions
What is the difference between employee engagement and employee satisfaction?
Satisfaction describes how content employees are with what the organization provides: compensation, benefits, work environment. Engagement describes how invested employees are in what they contribute: discretionary effort, emotional commitment, advocacy. An employee can be highly satisfied and minimally engaged. Engagement predicts performance, retention, and referral behavior; satisfaction predicts the absence of complaints. Most organizations that believe they are measuring engagement are actually measuring satisfaction.
How often should employee engagement be measured?
Annual surveys are insufficient for managing a dynamic psychological state. Quarterly pulse surveys of 5 to 8 questions, supplemented by an annual comprehensive survey, provide the measurement cadence required for timely management of engagement trends. The appropriate cadence depends on organizational size and change rate; organizations undergoing significant change (restructuring, leadership transitions, rapid growth) should increase measurement frequency proportionately.
Who is responsible for employee engagement?
Engagement is a shared responsibility with differentiated roles. HR is responsible for designing the measurement system, providing coaching frameworks, and ensuring that development resources are available. Line managers are responsible for the primary engagement drivers: clear expectations, meaningful feedback, growth support, and psychological safety in their teams. Senior leadership is responsible for organizational purpose, strategic direction, and the culture conditions that either enable or undermine manager effectiveness. Programs that assign engagement responsibility entirely to HR consistently underperform because they misidentify where the primary leverage actually lives.
Can engagement be too high?
Research has identified an “over-engagement” pattern in some contexts, characterized by employees who are so absorbed in their work that boundaries, health, and sustainability are compromised. This is more accurately described as unsustainable work design than as genuine excess engagement, and it typically reflects systemic resourcing problems rather than too much employee investment. Within normal parameters, higher engagement consistently produces better individual and organizational outcomes.
What is the cost of employee disengagement?
Gallup’s research estimates that actively disengaged employees cost organizations approximately 34% of their annual salary in lost productivity. For an organization with 500 employees earning an average of $75,000, a 20% active disengagement rate represents approximately $2.55 million in annual productivity loss, before accounting for the impact on team engagement, quality, and voluntary turnover costs. These figures make engagement investment ROI calculations straightforward in organizations willing to apply them honestly.
Conclusion
Employee engagement is not a feeling program. It is a performance system.
The organizations that understand it this way, that treat engagement as the psychological and behavioral state that converts headcount into actual organizational capability, invest differently, measure differently, and produce different outcomes. They develop managers because that is where the leverage is. They design work for meaningfulness because that is what sustains investment. They measure frequently because engagement changes and the window for intervention closes quickly.
The organizations that treat engagement as an employee satisfaction program invest in events and benefits that produce short-term satisfaction bumps and no sustained behavioral change. Their engagement scores improve, their turnover does not, and they reach the conclusion that engagement does not actually drive business outcomes.
It does. The research is unambiguous. The question is whether the investment is going to the right places.
Develop the managers. Design the work. Measure what matters. The engagement will follow.