Application Completion Rate is the percentage of candidates who fully submit a job application after starting one. It is one of the most important top-of-funnel recruitment metrics , and one of the most ignored. Every candidate who clicks “Apply” but never hits “Submit” represents wasted ad spend, a shrinking talent pool, and a missed opportunity to find the right hire.
For talent acquisition teams using AI-powered hiring platforms, Application Completion Rate is a strategic lever. Improving it directly impacts cost per applicant, time to fill, candidate experience scores, and ultimately, the quality of your shortlist. The formula is straightforward:
Application Completion Rate (%) = (Completed Applications ÷ Started Applications) × 100
If you’re spending money to attract candidates but most of them never finish applying, you don’t have a sourcing problem , you have a conversion problem.
What Is Application Completion Rate?
Application Completion Rate measures the proportion of candidates who finish and submit a job application out of all candidates who began the process. It is expressed as a percentage.
This metric reveals how user-friendly your application process actually is. A low rate points to friction , overly long forms, poor mobile experiences, redundant data entry, or confusing instructions. A high rate indicates a streamlined, candidate-friendly process that keeps people moving through the funnel.
The inverse of this metric is commonly known as the Application Drop-Off Rate or Application Abandonment Rate. Both measure the same thing from opposite ends: one counts who stayed, the other counts who left.
Is Your Application Process Silently Rejecting Top Talent?
For decades, employers built hiring processes in the dark. Long-form applications with dozens of fields, mandatory cover letter uploads, and multi-page forms were the norm , and nobody had visibility into where candidates were actually abandoning the process. Drop-off was invisible. If a recruiter received 50 applications, they assumed 50 people were interested. They had no way of knowing that 500 others had started and quit halfway through.
AI has changed this entirely. Real-time funnel analytics, heatmaps, and behavioural tracking now expose exactly which fields, pages, and devices cause candidates to leave. AI-powered hiring platforms can auto-fill forms, parse resumes intelligently, and adapt applications dynamically based on the candidate’s device, source, and role. The data that was once invisible is now unavoidable , and the numbers are sobering.
On average, only 10.6% of candidates who click “Apply” actually complete the application. Mobile completion rates are even worse , approximately 1.5% on mobile compared to over 8% on desktop. And 92% of job seekers abandon applications midway through, most giving up if the process takes longer than 15 minutes. In fact, completion rates plummet by 365% when the application exceeds that threshold.
For talent acquisition leaders, this isn’t a minor UX annoyance. A low Application Completion Rate is a leading indicator of employer brand damage, wasted recruitment marketing spend, and talent pipeline shrinkage. Worse, the hiring process itself becomes an unintentional filter , not screening out unqualified candidates, but screening out the best ones. Skilled candidates with multiple offers have the lowest tolerance for friction. They leave first.
Consider a mid-sized SaaS company spending $40,000 per year on job ads. Their analytics reveal that 88% of candidates who click through never submit an application. The company isn’t losing candidates to competitors’ offers , it’s losing them to its own 45-field application form.
The ROI case writes itself. If a company receives 10,000 application starts per quarter with a 12% completion rate, that’s 1,200 completed applications. Improving to just 25% would yield 2,500 completed applications , a 108% increase in the talent pool with zero additional ad spend.
Your Resume Isn’t Getting Read
Let’s Get That Fixed!
75% of resumes get auto-rejected. avua’s AI Resume Builder optimizes formatting, keywords, and scoring in under 3 minutes, so you land in the “yes” pile.
The Psychology Behind Application Completion Rate
The numbers tell you what is happening. Psychology tells you why.
Cognitive Load and Form Fatigue
Every form field is a micro-decision. Name? Easy. Address? Fine. “Please describe a time when you demonstrated leadership in a cross-functional setting“? That’s where the brain starts negotiating an exit.
Miller’s Law suggests that humans can hold roughly 7 (± 2) chunks of information in working memory at once. When an application asks 30+ questions spanning personal details, work history, skills assessments, and open-ended prompts, it overwhelms the candidate’s cognitive capacity. The result isn’t careful, thoughtful answers , it’s abandonment.
Data backs this up: applications exceeding 25 questions see dramatic drops in completion. But the insight isn’t just “ask fewer questions.” The best-performing applications don’t ask less , they ask smarter. Progressive disclosure, conditional fields that adapt based on previous answers, and auto-populated data from resume parsing all reduce cognitive load without reducing the information collected.
Loss Aversion vs. Sunk Cost in the Application Funnel
Here’s the tension. Candidates who have already invested five or more minutes in an application feel the pull of sunk cost , “I’ve come this far, I might as well finish.” But the moment the perceived remaining effort exceeds the perceived value of the role, loss aversion takes over. They’d rather cut their losses than invest more time into an uncertain outcome.
This psychological tipping point is where most abandonment happens, typically on page two or three of a multi-step application. And here’s the counterintuitive part: progress bars can actually backfire. If a candidate has been filling out fields for eight minutes and the progress bar tells them they’re only 30% done, it doesn’t motivate them , it demoralises them.
The Paradox of Choice and Self-Selection Bias
When applications present too many open-ended questions, excessive dropdown menus, or unclear instructions, candidates experience decision paralysis. Each ambiguous field becomes a reason to hesitate, second-guess, and ultimately leave.
This creates a dangerous self-selection bias. Highly qualified candidates , the ones with multiple options and limited patience , are the first to abandon. They have alternatives. They’ll go where the process respects their time. Meanwhile, the candidates who power through a painful 40-minute application may simply be the ones with fewer options, not the strongest fits.
Simplifying choices in the application doesn’t reduce candidate quality. It increases the probability that your best candidates make it through the front door.
Application Completion Rate vs. Other Recruitment Funnel Metrics
Application Completion Rate doesn’t exist in isolation. Here’s how it compares to other key recruitment metrics:
| Metric | What It Measures | Key Difference from Application Completion Rate |
|---|---|---|
| Click-to-Apply Rate | % of job ad viewers who start an application | Measures attraction; ACR measures follow-through after initial intent |
| Offer Acceptance Rate | % of offers accepted by candidates | A bottom-of-funnel metric; ACR sits at the very top of the funnel |
| Time to Fill | Days from job opening to accepted offer | A duration metric; ACR is a conversion metric that directly feeds time to fill |
| Cost Per Hire | Total recruitment spend ÷ number of hires | A financial outcome; low ACR inflates cost per hire by wasting ad spend |
| Quality of Hire | Performance and retention of new hires over time | A lagging outcome metric; ACR is a leading indicator that gates talent pool quality |
| Source of Hire | Which channels produce completed hires | Identifies where candidates come from; ACR reveals what happens after they arrive |
Application Completion Rate is a leading indicator and a root-cause metric. It sits upstream of nearly every other recruitment KPI , when ACR drops, cost per hire rises, time to fill extends, and quality of hire suffers because the talent pool shrinks. Improving ACR creates a multiplier effect across the entire funnel.
What the Experts Say?
The application process is your first interview with the candidate , and right now, most companies are failing it. If 90% of interested applicants can’t get through your front door, you don’t have a sourcing problem. You have a conversion problem.
– Madeline Laurano, Founder, Aptitude Research
How to Measure and Improve Application Completion Rate?
Formula
The calculation is simple:
Application Completion Rate (%) = (Number of Submitted Applications ÷ Number of Started Applications) × 100
For example, if 280 candidates started the application process and 210 completed it, the Application Completion Rate is (210 ÷ 280) × 100 = 75%.
It’s also worth tracking the inverse: Application Abandonment Rate (%) = 100 − Application Completion Rate. In this example, that would be 25%.››
Application Completion Rate Benchmarks by Industry
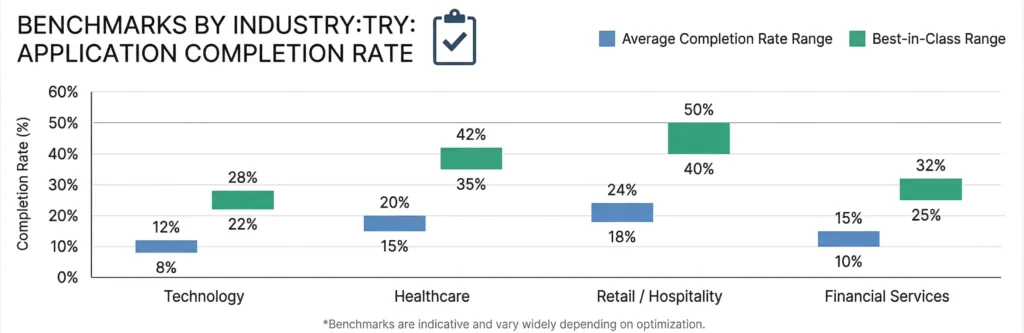
Benchmarks vary widely depending on form length, mobile optimisation, and ATS platform. “Best-in-class” figures typically reflect organisations with sub-5-minute, mobile-first application flows.
| Industry | Average Application Completion Rate | Best-in-Class |
|---|---|---|
| Technology | 8–12% | 22–28% |
| Healthcare | 15–20% | 35–42% |
| Retail / Hospitality | 18–24% | 40–50% |
| Financial Services | 10–15% | 25–32% |
Key Improvement Strategies
Five high-impact strategies to move the needle:
How Can AI and Automation Solve Application Completion Rate?
Intelligent Resume Parsing and Auto-Population
NLP-powered resume parsers extract structured data , name, contact details, work history, skills, education , from uploaded PDFs, Word documents, or LinkedIn profiles. This data is then used to auto-populate form fields, eliminating the single biggest cause of application abandonment: redundant data entry.
The impact is measurable. Organisations deploying intelligent parsing report 30–50% improvements in completion rates by cutting average application time from 15+ minutes to under five. Candidates upload one document, and the form fills itself. What took twenty minutes of tedious typing now takes thirty seconds.
Conversational Application Interfaces
AI chatbots are replacing static forms with conversational, guided experiences. Instead of dumping 30 fields on a screen, a chatbot asks one question at a time, adapts its follow-ups based on responses, and guides the candidate through the process like a dialogue rather than a bureaucratic checklist.
This approach is particularly effective for mobile candidates and high-volume roles in retail, hospitality, and logistics , industries where candidates are often applying from their phones during a break. Chat-based applications regularly achieve 3–4× higher completion rates compared to traditional form-based flows.
Predictive Abandonment Detection
Machine learning models can analyse real-time behavioural signals , mouse movement stalls, tab switches, time-per-field anomalies, scroll patterns , to predict which candidates are about to abandon. Once the model flags a high-risk session, the system intervenes: simplifying remaining fields, offering a “save and continue later” prompt, or triggering an immediate follow-up message.
This shifts Application Completion Rate management from reactive (measuring the damage after it happens) to proactive (preventing the drop-off in the moment). It’s the difference between a post-mortem and an early warning system.
Adaptive Form Logic and Personalisation
Not every candidate should see the same application. AI can dynamically adjust the form based on the candidate’s profile, source channel, device type, and the seniority of the role.
A senior engineering candidate referred through LinkedIn might skip basic screening questions entirely. A walk-in retail applicant on a mobile device gets a three-field micro-application. A returning candidate who previously abandoned sees a simplified “pick up where you left off” flow.
This “one-size-fits-none” approach means the application intelligently reduces itself to the minimum viable form for each candidate , maximising completion without sacrificing the data quality recruiters need.
Application Completion Rate and Diversity & Inclusion
Application Completion Rate isn’t just an efficiency metric , it’s a DEI metric. The friction baked into most application processes doesn’t affect all candidates equally.
Digital Access and Literacy Gaps
Candidates from lower-income backgrounds are more likely to apply on mobile devices or shared computers. Complex, desktop-optimised applications with auto-save issues disproportionately exclude these groups. The data makes this clear: mobile apply rates are roughly 5× lower than desktop. That isn’t a technology problem , it’s an equity problem.
In non-metro regions and tier-2/tier-3 cities, bandwidth limitations compound the issue. Heavy application portals with large file uploads can time out on slower connections, effectively blocking candidates who are otherwise qualified and motivated.
Language and Accessibility Barriers
Multi-step applications loaded with jargon, ambiguous field labels, and no multilingual support create real barriers for non-native speakers and neurodiverse candidates. WCAG 2.1 compliance in application forms isn’t just a legal checkbox , it directly impacts completion rates for candidates relying on screen readers, keyboard navigation, or assistive technologies.
Organisations that offer multilingual applications and use plain-language instructions see measurably higher ACR across diverse applicant pools. Clear language isn’t dumbing things down; it’s opening things up.
Bias in Self-Selection Through Friction
Research shows that women and underrepresented minorities are statistically more likely to abandon applications when they encounter ambiguous requirements, overly demanding credentialing questions, or “ideal candidate” language that signals exclusion. Long applications with optional fields labelled “preferred” create a quiet self-selection filter , candidates who lack confidence in ambiguous contexts, or who perceive the process as unwelcoming, exit first.
Improving Application Completion Rate is a DEI strategy. Removing unnecessary friction widens the top of the funnel for exactly the populations most organisations say they’re trying harder to reach.
Common Challenges & Solutions
| Challenge | Solution |
|---|---|
| High abandonment on page 2 of a multi-step application , Candidates complete basic info but drop off when asked to upload documents or answer long-form questions. | Implement a “quick apply” option that captures core data first, then requests supplementary documents asynchronously via a follow-up email within 24 hours. |
| Mobile completion rates significantly below desktop , Forms are technically responsive but not mobile-optimised (tiny buttons, horizontal scrolling, no auto-fill). | Redesign the candidate-facing form as mobile-first, not mobile-adapted. Use native device features: camera for document capture, auto-fill APIs, and thumb-zone button placement. |
| ATS platform forces a rigid, one-size-fits-all application , The existing system doesn’t support conditional logic or form customisation by role type. | Decouple the candidate-facing application layer from the ATS backend. Use a lightweight front-end form builder (or an AI-powered platform like Avua) that feeds data into the ATS via API. |
Real-World Case Studies
Case Study 1: Mid-Size IT Services Firm (1,200 Employees)
A mid-size IT services company was spending ₹12 lakh per quarter on job board ads but converting only 13% of clicks into completed applications. The culprit was a six-page application form that took an average of 22 minutes to complete , including mandatory fields for cover letters, education history, and three professional references.
They consolidated the application to two steps and 12 fields, enabled LinkedIn auto-import for professional details, and removed the cover letter and education history requirements from the initial submission. Within 60 days, their Application Completion Rate improved from 13% to 34%. Cost per completed application dropped by 62%, and time to fill decreased by 11 days on average.
Case Study 2: Regional Healthcare Network (3 Hospital Campuses)
A healthcare network found that nursing candidates were consistently abandoning applications at the credential upload step. The form required mandatory uploads of nursing licences, certifications, and immunisation records before a candidate could even submit the application.
The fix was structural, not cosmetic. They moved credentialing to a post-application verification step, allowing candidates to submit a basic application first and upload documents within 72 hours via a personalised follow-up link. Application Completion Rate for nursing roles jumped from 19% to 47%. The recruiter team reported a 40% larger qualified candidate pool per open req, with no decline in credential compliance at point of hire.
Case Study 3: National Quick-Service Restaurant Chain (500+ Locations)
A national QSR chain discovered that 94% of their applications were being started on mobile devices , but their legacy ATS form was not mobile-optimised. Mobile completion rate was 4%.
They deployed a chat-based, mobile-first micro-application: name, availability, location, and two screening questions. Full details were collected during a five-minute automated phone screen scheduled immediately after submission. Mobile Application Completion Rate jumped from 4% to 61%. Time to fill for hourly roles dropped from 18 days to 7, and candidate satisfaction (post-application NPS) improved by 38 points.
Building an Application Completion Rate Dashboard: What to Track?
If you’re serious about improving ACR, you need a dedicated dashboard. Here are the seven metrics that should be on it:
Application Completion Rate Across the Candidate Lifecycle
Application Completion Rate is usually treated as a single-point metric , did the candidate finish the form? But drop-off happens at every stage of the hiring lifecycle, and the same principles apply throughout.
Pre-Application Drop-Off
Before a candidate even clicks “Apply,” they encounter the careers page, job description, and employer brand content. If the listing is vague, the culture seems unclear, or the “Apply” button is buried below a wall of text, candidates leave before the application starts. This isn’t measured in ACR directly, but it shapes it , a poorly designed careers page depresses both the volume and the intent of application starts.
Assessment-Stage Abandonment
Many companies attach skills tests, video interview prompts, or psychometric assessments directly to the application flow. Each added step introduces a new abandonment risk. The interview and assessment stage witnesses the highest drop-off rate, with roughly 25% of candidates opting out. The lesson: assessments should be decoupled from the initial application and introduced after qualification, not as a gate to entry.
Interview Scheduling Friction
Even after a completed application, candidates face scheduling friction , back-and-forth emails, timezone confusion, and no-show rescheduling. Approximately 42% of candidates withdraw from a hiring process because scheduling took too long. AI-powered scheduling tools with real-time calendar access and self-service booking can compress this step from days to minutes.
Offer-Stage Drop-Off
Silence after offer delivery is the final completion rate failure. Offer acceptance rates in the U.S. currently sit at approximately 79%, meaning one in five candidates who receive an offer don’t complete the hiring lifecycle. Causes include competing offers, slow follow-up, unclear compensation details, or a negative experience earlier in the process that quietly eroded trust. Organisations should track “Offer Completion Rate” as the lifecycle bookend to Application Completion Rate , both measure the same underlying truth: friction kills conversion.
The Real Cost of Application Completion Rate: By the Numbers
For a company hiring approximately 100 roles per year, assuming 10,000 application starts per quarter, the impact of friction in the candidate experience is staggering.
| Scenario | Application Completion Rate | Completed Applications | Estimated Wasted Ad Spend (at $1.00/click) |
| Current State (High Drop-Off) | 12% | 1,200 | $8,800 /quarter |
| Moderate Improvement | 25% | 2,500 | $7,500 /quarter |
| Best-in-Class | 45% | 4,500 | $5,500 /quarter |
Related Terms
| Term | Definition |
|---|---|
| Application Abandonment Rate | The inverse of Application Completion Rate , the percentage of candidates who start but do not finish an application. |
| Click-to-Apply Rate | The percentage of job ad viewers who initiate an application after clicking through. |
| Candidate Drop-Off Rate | The broader measure of candidates exiting at any stage of the recruitment funnel, not just the application step. |
| Time to Fill | The number of days between a job opening being posted and an offer being accepted. |
| Candidate Experience Score | A composite metric (often NPS-based) measuring a candidate’s satisfaction with the entire hiring process. |
Frequently Asked Questions
What is a good Application Completion Rate?
It depends on industry and application complexity. For technology roles, 20–28% is considered best-in-class. For retail and hospitality, aim for 40% or higher. The overall cross-industry average hovers around 10–15%. If your rate is below 10%, your application process is very likely too long, not mobile-friendly, or both.
Does shortening the application form improve Application Completion Rate?
Yes, and significantly. Research shows that applications taking under five minutes see apply rates of 12.5%, compared to just 3.6% for forms exceeding 15 minutes. Reducing fields from 40+ to under 15 can improve ACR by 2–3× while still capturing enough data to screen candidates effectively.
How does AI-powered resume parsing reduce application abandonment?
AI resume parsers extract candidate data from uploaded documents and auto-populate form fields, eliminating redundant manual entry. This typically reduces application time from over 15 minutes to under five. Organisations deploying intelligent parsing report 30–50% improvements in completion rates because the number one abandonment trigger , repetitive data entry , is removed entirely.
Can abandoned applications be recovered?
Yes. Automated “save and return” emails triggered within one to two hours of abandonment recover 10–20% of dropped applications. SMS nudges perform even better, with response rates roughly 8× higher than email. The key is speed , candidates who abandoned today are applying elsewhere tomorrow. Real-time detection paired with instant follow-up is the most effective recovery strategy.
Does Application Completion Rate affect Quality of Hire?
Directly. A low Application Completion Rate shrinks the talent pool, which statistically reduces the likelihood of finding the best candidate. High-friction applications disproportionately screen out top-tier talent , skilled candidates with multiple options are the first to abandon. Improving ACR by even 10 percentage points typically expands the qualified candidate pool by 25–40%, giving hiring managers stronger shortlists to work with.
Conclusion
Application Completion Rate is more than a recruitment metric. It’s a direct reflection of how an organisation values a candidate’s time, attention, and experience. A low ACR isn’t a minor operational inefficiency sitting quietly in a dashboard , it’s a strategic failure that compounds across the entire hiring funnel, inflating costs, extending timelines, shrinking talent pools, and silently filtering out the very people you’re trying hardest to hire.
The highest-leverage fixes are well understood: mobile-first design, AI-powered resume parsing, form field reduction, and real-time abandonment recovery. None of these require a multi-year transformation. Most can be implemented in weeks.
The organisations that will consistently out-hire their competitors in 2026 and beyond are the ones that treat Application Completion Rate as a strategic KPI , tracked weekly, benchmarked by role and device, and owned jointly by talent acquisition and product teams. In a market where every qualified candidate counts, the companies that make it easiest to apply will be the ones that make the best hires.