Most hiring conversations start with acquisition: sourcing, screening, interviewing, closing. What they should start with is a number most organizations already have, rarely track rigorously, and almost never tie back to their recruiting spend. That number is the attrition rate.
Attrition rate is the percentage of employees who leave an organization over a defined period. It is one of the most consequential metrics in talent management, yet it consistently sits at the edge of TA conversations rather than the center. When attrition goes unexamined, every new hire quietly subsidizes the cost of a departure that was probably preventable.
AI hiring platforms have made attrition analysis genuinely actionable. Organizations can now connect applicant pool quality, candidate engagement signals, and early onboarding behavior to long-term retention outcomes. The data exists. The tools exist. What most talent teams are still missing is the habit of asking the attrition question before the sourcing conversation even begins.
The foundational metric is the Annual Attrition Rate (AAR), defined as the percentage of an organization’s workforce that leaves over a 12-month period. It is the baseline diagnostic for workforce stability, and every subsequent analysis in this article branches from it. An organization that does not know its AAR does not know the real cost of its talent function.
What is Attrition Rate?
Attrition rate is a workforce stability metric that quantifies the rate at which employees exit an organization, whether voluntarily through resignation, involuntarily through termination or layoff, or through retirement and natural departure.
The term is sometimes used interchangeably with “turnover rate,” but there is a meaningful distinction worth preserving. Turnover implies replacement: an employee leaves and the role is immediately refilled. Attrition implies shrinkage: the workforce reduces and the role may not be backfilled. In practice, most TA and HR teams use attrition as the umbrella term covering all departures, and this article follows that convention.
What attrition rate measures, at its core, is the velocity at which an organization loses institutional knowledge, trained capacity, and the investment it has made in its people. Every departure has a cost. Every preventable departure has a larger one.
Is Your Attrition Rate a Talent Strategy Signal or Just Background Noise?
There is a version of attrition management that looks like this: the annual engagement survey comes back, the scores are discussed in an HR leadership meeting, a few initiatives are proposed, and the attrition rate for the following year is approximately what it was the year before. This is attrition as ritual acknowledgment rather than operational intelligence.
The version that actually moves the needle looks different. It starts with segmenting the attrition rate by role, level, tenure, manager, location, and hire source simultaneously. It asks which departures were predictable in advance, which were preventable in retrospect, and which were actually healthy for the organization. It connects the attrition data to the recruiting data, so the cost of every departure is visible alongside the cost of every hire.
The scale of what’s at stake here is not abstract. The average cost to replace an employee sits between 50% and 200% of their annual salary, depending on role complexity and seniority. For a mid-market company with 500 employees, an annual attrition rate of 20% means 100 departures per year. At a conservative replacement cost of $25,000 per employee, that is $2.5 million annually in attrition-driven spend. Reduce that attrition rate by five percentage points and you recover $625,000 without hiring a single additional person or running a single additional campaign.
For TA leaders, the reframe that matters most is this: attrition rate is a recruiting quality metric. The quality of a hire is not measured at the offer stage. It is measured at the 6-month performance review, the 12-month retention point, and the 24-month tenure mark. A hiring function that optimizes for speed and volume without tracking what happens to those hires downstream is flying with incomplete instruments. The attrition rate is the instrument that closes the loop.
The scenario that illustrates this most clearly: a technology company runs a high-volume engineering recruitment campaign and fills 80 roles in a quarter. Everyone celebrates the speed-to-fill number. Twelve months later, 34 of those hires have left. The campaign that looked like a success was actually producing first-year attrition at nearly twice the industry average. The sourcing channel responsible for the fastest fills was also responsible for the worst retention. That information was available in the data. No one had looked.
The ROI math on getting this right is significant. If that same company reduces first-year attrition by 15 percentage points through improved role-fit screening and candidate expectation alignment, and the average replacement cost per engineer is $45,000, the annual saving on a team of 80 is $540,000. That is the business case for treating attrition rate as a first-order strategic metric rather than a lagging HR indicator.
Your Resume Isn’t Getting Read
Let’s Get That Fixed!
75% of resumes get auto-rejected. avua’s AI Resume Builder optimizes formatting, keywords, and scoring in under 3 minutes, so you land in the “yes” pile.
The Psychology Behind Attrition
Understanding why people leave requires going one layer deeper than exit interview data, which is notoriously unreliable because departing employees routinely soften their real reasons to preserve relationships and references. The psychology of attrition is more complex than “they got a better offer elsewhere.”
The Expectation Gap
The single most consistently cited driver of early attrition is a mismatch between what a candidate expected the role to be and what the role actually turned out to be. This is not primarily a candidate problem. It is a job description problem, a recruiter communication problem, and a hiring manager framing problem.
When organizations oversell the excitement of a role, understate its operational demands, or simply describe the job that existed two years ago rather than the job that exists today, they are manufacturing departure intent before the first day. Expectation calibration during the hiring process is one of the highest-leverage interventions available for reducing early attrition, yet most organizations treat the interview as a selling exercise rather than a mutual evaluation.
Belonging and Psychological Safety
Research on mid-tenure attrition consistently identifies belonging as the dominant variable. Employees who feel genuinely connected to their team, trusted by their manager, and safe to raise concerns without fear of social or professional consequence stay significantly longer than those who do not, even when offered competitive compensation elsewhere.
The implication for attrition management is that the driver is often invisible in standard HR metrics: an employee who stops participating in team discussions, withdraws from informal communication channels, and progressively disengages is typically 90 days from resignation. The signal was there; the infrastructure to detect it was not.
The Manager Variable
If you want to understand your attrition rate, understand your managers. The relationship between direct management quality and team-level attrition is one of the most robustly documented findings in organizational psychology. Employees do not leave organizations; they leave managers. In 2026, AI-enabled people analytics platforms can now identify manager-level attrition outliers with statistical confidence, flagging teams where departure rates are significantly above the organizational baseline and prompting investigation before the problem compounds. This is not punitive data; it is diagnostic data. The manager with the highest team attrition is often the one most in need of development, not the one most in need of performance management.
Attrition Rate vs. Other Workforce Health Metrics
Attrition rate sits within a broader ecosystem of workforce metrics, each measuring a different dimension of organizational health:
| Metric | What It Measures | Key Difference from Attrition Rate |
|---|---|---|
| Turnover Rate | Departures where the role is backfilled | Attrition includes roles that are eliminated, not just replaced |
| Retention Rate | Percentage of employees who stay | The inverse of attrition; retention focuses on those present rather than those departed |
| Engagement Score | Employee sentiment and commitment | A leading indicator; attrition is the lagging outcome of low engagement |
| Quality of Hire | Post-hire performance and fit | Attrition is one measure of quality of hire over time |
| Time to Productivity | How quickly new hires reach full output | High attrition often correlates with poor onboarding, which drives slow productivity |
| Offer Acceptance Rate | Proportion of offers accepted | Measures the start of tenure; attrition measures the end |
The critical insight: attrition rate is almost always a lagging indicator of problems that were visible earlier in other metrics. High attrition in a specific team usually follows a documented dip in engagement scores. High first-year attrition usually traces back to screening processes that were optimizing for the wrong fit signals. Using attrition rate as the only workforce health metric is like diagnosing a patient’s condition by reading only their discharge notes.
What the Experts Say?
Attrition isn’t a workforce planning problem. It’s a data literacy problem. The organizations that crack it are the ones that connect their exit data to their hire data and ask the question no one else is asking: where did this departure begin?
– Patty McCord, Former Chief Talent Officer at Netflix and author of “Powerful”
How to Measure Attrition Rate?
Accurate measurement is the precondition for everything else in attrition management. The formula is straightforward; the discipline required to apply it consistently is not.
Formula
Attrition Rate = (People who left ÷ Total employees on average) × 100
Average headcount is calculated as (headcount at start of period + headcount at end of period) / 2. Using a static headcount figure rather than an average will produce distorted results in organizations that are growing or contracting significantly during the measurement period.
Beyond the headline AAR, organizations tracking attrition with genuine rigor segment the metric by at minimum three dimensions: voluntary vs. involuntary (were people choosing to leave or being asked to?), tenure band (are departures clustered in the first year, the second year, or at the five-year mark?), and role or function (is engineering attrition three times higher than operations attrition, and if so, why?).
Benchmarks by Industry (2026 Data)
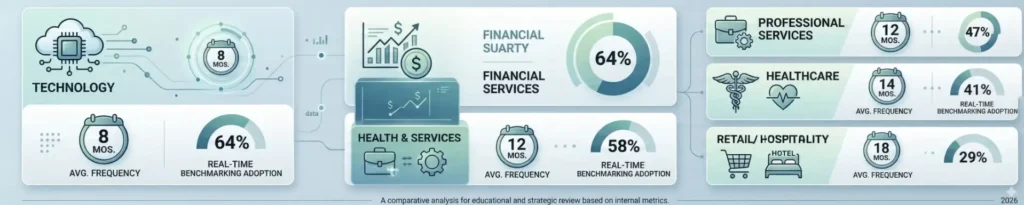
| Industry | Average Annual Attrition Rate | Best-in-Class (Retention-Optimized) |
|---|---|---|
| Technology | 18.3% | 9.1% |
| Retail / Hospitality | 31.7% | 18.4% |
| Healthcare | 22.5% | 12.6% |
| Financial Services | 14.2% | 7.8% |
| Professional Services | 16.9% | 8.3% |
The gap between average and best-in-class is not primarily a compensation gap. Compensation-driven attrition is real but limited; beyond a certain threshold, salary increases have diminishing retention effect. The gap between average and best-in-class organizations most consistently traces to three variables: quality of first-line management, clarity of career progression, and the degree to which the role experience matches the candidate’s pre-hire expectations.
Key Strategies for Reducing Attrition Rate
Attrition reduction is not a single initiative. It is a system of interventions operating across the full employee lifecycle. The organizations that move their attrition rate meaningfully do so by addressing multiple leverage points simultaneously:
How AI and Automation Address Attrition?
The data that predicts attrition has always existed in organizations. What was missing until recently was the infrastructure to identify patterns within it at scale and in time to act. AI changes that in several important ways:
Predictive Attrition Modeling
Machine learning models trained on historical employee data (tenure, performance ratings, engagement scores, manager relationships, compensation trajectory, promotion history, and internal mobility) can identify employees with elevated departure probability before they have made a decision to leave. In 2026, the best predictive attrition models achieve accuracy rates above 75% at the 90-day horizon. That means three months of lead time to intervene: a retention conversation, a development opportunity, a role adjustment, or a compensation review. The cost of that intervention is almost always lower than the cost of the departure it prevents.
AI-Driven Hire Quality Signals
The connection between hiring decisions and downstream attrition is the most underexplored frontier in TA analytics. AI platforms that track the full journey from sourcing channel through hire through departure can identify which screening signals (or absence of them) are most predictive of short tenure. This closes the feedback loop that most TA functions are missing: the information about what happened to the people they hired, used to improve the decisions they make about the next cohort.
Engagement Signal Analysis
Passive engagement signals (communication frequency, meeting participation patterns, collaboration network analysis, and response latency in team channels) can provide continuous, real-time indicators of belonging and engagement that are more accurate than annual survey data and available 365 days a year rather than once. AI systems that aggregate these signals and flag anomalous changes for manager attention are emerging as one of the highest-value tools in early attrition detection.
Exit Intelligence Automation
Traditional exit interviews produce qualitative data that is difficult to analyze at scale and easy to discount as anecdotal. AI-powered exit intelligence platforms conduct structured digital exit conversations, analyze response patterns at scale, and surface systemic themes that individual exit interviews would never reveal. When 34 engineering departures in a 12-month period all reference “lack of technical challenge” as a contributing factor, that is a product of the engineering function that requires structural attention, not a collection of individual preferences.
Stop Juggling
10 Job Boards.
Search One
Your next role is already here. avua pulls opportunities from across the web into a single searchable feed; filtered by role, location, salary, and remote preference.
1.5 Million+
Active Jobs
380+
Job Categories
Attrition Rate and Diversity and Inclusion
One of the most revealing analyses any organization can run is an attrition rate segmented by demographic group. If certain groups are leaving at disproportionately higher rates than others, the overall attrition rate is obscuring an inequity problem that requires specific attention.
Differential Attrition as an Equity Signal
When women, employees from underrepresented racial or ethnic backgrounds, or employees with disabilities leave at rates significantly higher than the organizational average, the cause is rarely the individuals themselves. It is the environment they are navigating. Differential attrition is the cumulative outcome of microaggressions, lack of sponsorship, exclusion from informal networks, and the daily friction of operating in a culture that was not designed with their full participation in mind. Identifying differential attrition is the first step; acting on its causes is the harder and more important one.
Onboarding Inclusion Gaps
First-year attrition rates for diverse hires are frequently higher than for the general employee population, and the driver is almost always an onboarding experience that inadvertently emphasizes how different the new hire is from the established team rather than building genuine belonging. Inclusive onboarding design, including diverse buddy and mentor assignments, explicit team norm-sharing, and early relationship structures that connect new hires to peers with similar backgrounds, demonstrably reduces early attrition among underrepresented employees without affecting the onboarding experience for anyone else.
Pipeline Integrity Over Time
Reducing attrition among underrepresented groups is not just an equity goal; it is a pipeline integrity goal. Organizations that hire diversely but retain inequitably end up with senior leadership that looks like a funnel with a leak in the middle. Attrition data, segmented by level and demographic group, makes that leak visible and actionable in a way that aggregate attrition numbers never can.
Common Challenges and Solutions
| Challenge | Solution |
|---|---|
| High First-Year Attrition | Implement Realistic Job Previews in the hiring process and structured 90-day onboarding programs |
| Data Silos Between HR and TA | Build shared dashboards that connect hire source, screening outcomes, and departure data in one view |
| Manager-Driven Attrition | Use team-level attrition segmentation to identify outlier managers and invest in targeted development |
| Exit Data Quality | Replace voluntary exit interviews with AI-structured exit conversations that produce analyzable, comparable data |
| Engagement Survey Lag | Supplement annual surveys with passive engagement signals and quarterly stay interviews for high-risk populations |
Real-World Case Studies
Case Study 1: The Retail Chain
A 6,000-employee retail chain was running annual attrition of 38%, broadly accepted as normal for the sector, despite costing the business an estimated $4.2 million per year in replacement and training spend. When they segmented the attrition data by store manager rather than treating it as a chain-wide aggregate, the picture changed dramatically. Attrition rates across stores ranged from 18% to 61%.
The stores at the top and bottom of that range were in comparable markets, paying comparable wages, with comparable customer volumes. The variable was management quality. A targeted manager development program, focused on the 20% of store managers responsible for 60% of total departures, reduced chain-wide attrition to 27% within 18 months. Annual attrition-related spend dropped by $1.3 million.
Case Study 2: The FinTech Scale-Up
A FinTech company experiencing rapid growth was seeing 28% first-year attrition among new engineering hires, compared to an industry benchmark of 14%. Analysis of exit interview data revealed a consistent theme: engineers reported that the role they had been hired into was “not what they had been told”.
The hiring process had consistently presented the role as involving significant greenfield product work; the reality was a mix of legacy system maintenance and feature development that most engineers found less stimulating than advertised. The fix was a Realistic Job Preview redesigned into the second interview stage, including a transparent session with two current engineers describing their actual day-to-day work. First-year attrition dropped to 16% within two hiring cohorts, with no change in offer acceptance rates.
Case Study 3: The Healthcare Provider
A mid-size healthcare provider was experiencing differential attrition: its overall annual rate was 19%, but attrition among nursing staff from underrepresented backgrounds was running at 31%. A root-cause analysis combining exit intelligence data and stay interview findings identified two primary drivers: limited access to sponsorship from senior clinical leaders, and an onboarding program that connected new nurses to buddies who were not demographically representative of the new hire’s own background.
They redesigned their buddy assignment process, established a structured sponsorship program connecting diverse nurses to senior clinical mentors, and implemented a 60-day check-in structure specifically for first-year hires. Within 12 months, attrition among underrepresented nursing staff had reduced to 22%, and they were on track to reach parity with the organizational average within two years.
Building an Attrition Rate Dashboard: What to Track?
Attrition data is only useful if it is organized in a way that surfaces actionable patterns rather than just aggregating departures. A well-designed attrition dashboard tracks:
Attrition Rate Across the Employee Lifecycle
Attrition is not a single-point event. It is the outcome of experiences and decisions distributed across the full employment journey. Understanding where it originates is essential to knowing where to intervene.
Pre-Hire Attrition Seeds
Attrition that occurs in the first three months is almost always seeded before the hire is made. It originates in job descriptions that oversell the role, interview processes that prioritize selling the candidate over assessing fit, and compensation offers that create immediate equity concerns when the new hire arrives and benchmarks their package against colleagues. Addressing first-quarter attrition requires TA teams to audit what candidates are being told during the hiring process and compare it honestly against what they will actually experience.
Onboarding and Early Tenure
The 30 to 180 day window is the highest-risk period for departure and the window where intervention has the greatest return. Employees who are clearly connected to their team by day 30, have a defined performance target by day 60, and have had a meaningful career conversation by day 90 are substantially more likely to reach the 12-month mark. These are not complicated interventions. They are structured, scheduled, and consistently executed ones.
Mid-Tenure Retention
Attrition in the 1 to 3 year range is primarily driven by career development and manager relationship quality. Employees at this tenure stage have sufficient organizational knowledge to recognize whether they are on a trajectory they find meaningful. If they cannot see a clear path forward, the decision to look externally is rational, not disloyal. The organizations that retain at this stage are those with visible internal mobility, active manager-employee development conversations, and compensation practices that keep pace with the external market without requiring an exit offer to trigger a review.
Long-Tenure Attrition
Departures at the 5-year mark and beyond are typically driven by identity and purpose rather than compensation or career mechanics. Employees who have been in a role for five years and choose to leave are usually seeking something they cannot find internally: a new challenge, a meaningful mission shift, or a leadership opportunity that the organization cannot provide. Long-tenure attrition is often the healthiest category of departure for both parties, but tracking it helps organizations understand the ceiling on their internal development pathways and plan succession accordingly.
The Real Cost of Attrition: By the Numbers
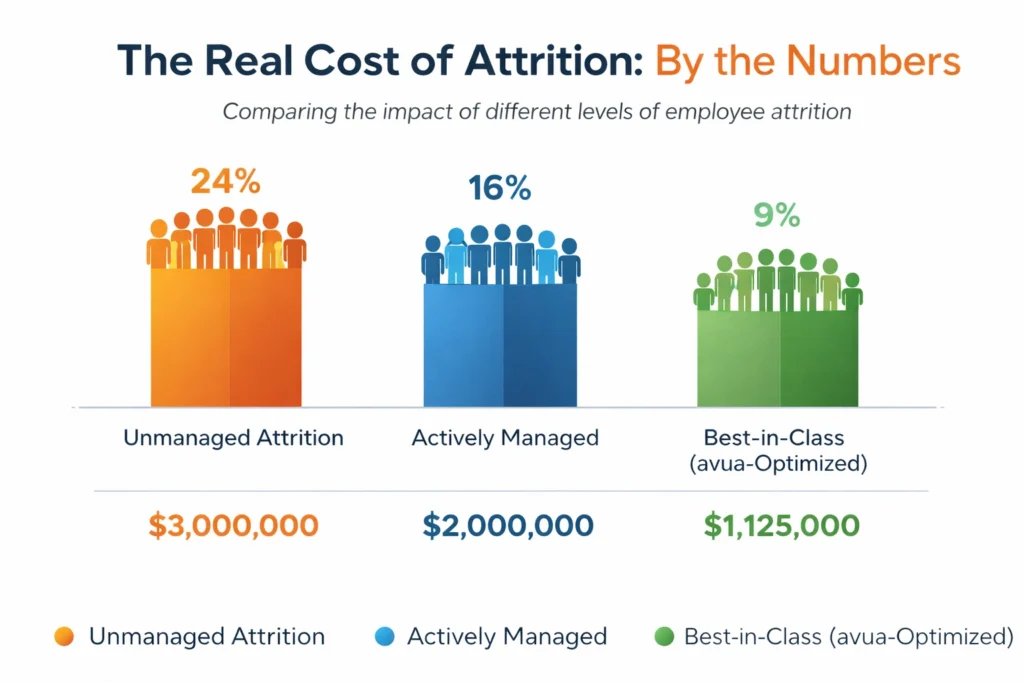
| Scenario | Annual Attrition Rate | Departures (500 employees) | Estimated Annual Cost |
|---|---|---|---|
| Unmanaged Attrition | 24% | 120 employees | $3,000,000 |
| Actively Managed | 16% | 80 employees | $2,000,000 |
| Best-in-Class (avua-Optimized) | 9% | 45 employees | $1,125,000 |
The $1.875 million gap between unmanaged and best-in-class attrition at 500 employees is not a speculative figure. It is built on a conservative $25,000 replacement cost estimate, which is well below the true fully-loaded cost for most professional and technical roles when recruiting fees, onboarding time, productivity ramp, and team disruption are included. For roles above the median salary, the case for active attrition management becomes compelling faster.
Related Terms
| Term | Definition |
|---|---|
| Turnover Rate | The rate at which employees leave and are replaced within a defined period |
| Retention Rate | The percentage of employees who remain with the organization over a given timeframe |
| Regrettable Attrition | Departures of employees whose loss negatively impacts organizational performance or culture |
| Flight Risk | An employee identified as having elevated departure probability within a near-term window |
| Stay Interview | A structured conversation with current employees to understand what would increase their likelihood of remaining |
| First-Year Attrition | Departures occurring within the first 12 months of employment, typically the most preventable category |
Frequently Asked Questions
What is a healthy attrition rate?
There is no universal healthy attrition rate, because what is normal varies significantly by industry, role type, and organizational growth stage. However, a working rule of thumb for most professional services and technology organizations is that voluntary attrition below 10% reflects strong retention health, 10 to 18% is manageable, and above 18% warrants systematic investigation. Retail and hospitality operate on different norms and require industry-specific benchmarks.
What is the difference between attrition and turnover?
Attrition typically refers to workforce reductions where the departing role is not backfilled: the headcount shrinks. Turnover refers to departures where the role is immediately replaced. In practice, many organizations use the terms interchangeably to mean all departures. The important thing is to define and apply the term consistently within your own measurement framework rather than assuming comparability with externally reported benchmarks.
How does attrition rate affect employer brand?
High attrition creates a self-reinforcing employer brand problem. Departing employees share their reasons for leaving through professional networks and review platforms. High-quality candidates research these signals before applying. A company with a reputation for poor retention will find that its strongest candidates, the ones most worth hiring, are also the ones most likely to self-select out of the application process. Managing attrition is therefore partly a talent acquisition strategy, not just a retention one.
Can predictive attrition models be used ethically?
Yes, with important design constraints. Predictive attrition modeling is ethical when it is used to trigger retention conversations and development investments, not to make employment decisions or discriminate against employees identified as flight risks. The model should surface opportunities to improve the employee experience; it should never be used to disadvantage employees who happen to score highly on departure probability.
How quickly can attrition rate be improved?
Meaningful movement in attrition rate is typically visible within two to three hiring cohorts for first-year attrition interventions, and within 12 to 18 months for broader organizational retention programs. The fastest improvements come from fixing the highest-volume causes: expectation gaps in the hiring process and the highest-attrition manager populations. Patience is required for systemic drivers like culture and career development infrastructure, where change operates on a longer timeline.
Conclusion
Attrition rate is not a number that lives in the HR team’s quarterly report. It is the verdict that your employees deliver, collectively, on their experience of your organization. Every departure is a data point. The pattern across those data points tells a story about what is working and what is not in your hiring, onboarding, management, and career development systems.
The organizations winning the talent competition in 2026 are not necessarily the ones with the biggest recruiting budgets or the most sophisticated sourcing technology. They are the ones that have closed the loop between the decisions they make at the front of the talent pipeline and the outcomes they measure at the back of it. They know which hires stayed and which left. They know why. And they use that knowledge to make better decisions the next time.
The attrition rate is where that accountability lives. Track it with rigor, segment it with intention, and treat every departure as a question worth answering. The organizations that do this consistently do not just reduce a metric. They build a workforce that compounds in value rather than leaking it.