Filling a role fast is easy. Filling it with the right person is the part that actually matters.
Quality of hire is the metric that separates organisations that measure hiring success by speed and volume from those that measure it by what happens after the offer is signed, and it is quickly becoming one of the most important indicators in modern talent strategy.
Quality of hire is a composite measure of how well a new employee performs, integrates, and contributes relative to the expectations set during the hiring process. It connects recruitment decisions directly to business outcomes, making it the clearest link between talent acquisition and the value HR delivers to the wider organisation. For teams investing in data-driven recruiting, it is the metric that gives everything else context.
Tracking quality of hire also sheds light on the effectiveness of your sourcing channels, your screening process, and your candidate persona definitions. If the people you are hiring consistently underperform against expectations, the problem rarely starts after they join. It starts in how roles are defined, how candidates are evaluated, and how well employee onboarding sets them up to succeed.
Over time, quality of hire data feeds directly into employee retention strategy, revealing which hiring sources, interview formats, and onboarding approaches produce employees who stay, grow, and deliver. This guide covers how to measure it, what to track, and how to use it to make every future hire a little sharper than the last.
The core metric governing Quality of Hire programs is the Quality of Hire Score, calculated as a composite of multiple post-hire performance indicators at the twelve-month mark.
Quality of Hire Score = (Performance Rating Score + Retention Rate Score + Hiring Manager Satisfaction Score + Time-to-Productivity Score) / 4
High-performing talent acquisition functions maintain Quality of Hire Scores consistently above 80 on a 100-point composite scale. Organizations measuring Quality of Hire for the first time typically score between 58 and 67, not because hiring has suddenly deteriorated, but because measurement has made visible what was always true.
What is Quality of Hire?
Quality of Hire is a composite recruitment metric that measures the actual value a new employee delivers relative to the organization’s expectations, assessed across multiple dimensions including job performance, retention, hiring manager satisfaction, cultural contribution, and speed to full productivity, evaluated at defined intervals of 30, 90, 180, or 365 days after the hire’s start date.
The defining characteristic of Quality of Hire as a metric is that it measures outcomes, not inputs. Time-to-fill measures process speed. Cost-per-hire measures process efficiency. Quality of Hire measures whether the process worked. It is the only recruitment metric directly connected to the business consequence that talent acquisition is supposed to serve: placing the right person in the right role so the organization performs better as a result.
Why Is Quality of Hire the Most Consequential Metric in Modern Talent Strategy?
Organizations that optimize exclusively for speed and cost metrics consistently discover the same problem: fast, cheap hiring produces a disproportionate number of bad hires, and bad hires are neither fast nor cheap to resolve. According to SHRM’s talent acquisition research, the average cost of a bad hire at the individual contributor level exceeds $17,000 when recruitment, onboarding, training, productivity loss, and replacement costs are aggregated. For senior roles, that figure rises to three to five times base salary. These numbers do not appear on the dashboard that measures time-to-fill. They appear on the P&L six months later, attributed to everything except the recruitment decision that caused them.
The less examined dimension of Quality of Hire is its compounding effect at the team level. A single underperforming hire in a ten-person team does not just reduce that team’s output by ten percent. LinkedIn’s Global Talent Trends research consistently shows that performance within high-functioning teams is interdependent: one underperformer forces higher-performing colleagues to compensate, redirects manager attention toward performance management rather than development, and in the most damaging cases degrades team culture in ways that accelerate voluntary attrition among the strongest performers. The talent system effects of a bad hire are multiplicative, not additive.
The ROI math for investing in Quality of Hire improvement is stark. Consider a technology company making 40 hires per year with an average base salary of $95,000. If the company’s current bad hire rate is 20%, which is the industry average per SHRM, it is absorbing approximately 8 bad hires annually at an average cost of $34,000 each (roughly one-third of base salary for mid-level roles). That represents a $272,000 annual loss. Reducing the bad hire rate from 20% to 10% through structured interviewing, validated assessments, and data-driven recruiting practices saves approximately $136,000 annually, a return that dwarfs the investment required to build the Quality of Hire infrastructure.
The concrete scenario that illustrates the point: a financial services firm conducts a post-hire audit of 50 hires made over the previous 18 months and discovers that 16, or 32%, have underperformed against expectations at the 12-month mark. Exit interviews and manager feedback consistently identify two patterns: interviews were unstructured and credential-focused, and the definition of success in each role was never specified before sourcing began. The hires looked right on paper. They underperformed in practice. Quality of Hire measurement would have surfaced this pattern after the second hire, not the sixteenth, and the course correction would have cost a fraction of the eventual remediation.
For TA leaders, the practical conclusion is this: Quality of Hire should be positioned not as a measurement exercise but as the feedback loop that makes every other talent acquisition investment more effective. Every sourcing channel, every assessment tool, and every interview framework should be evaluated against its contribution to Quality of Hire, not against its speed or cost. Organizations that make this shift consistently report higher candidate quality, faster hiring manager confidence in decisions, and meaningfully lower early-tenure attrition.
Your Resume Isn’t Getting Read
Let’s Get That Fixed!
75% of resumes get auto-rejected. avua’s AI Resume Builder optimizes formatting, keywords, and scoring in under 3 minutes, so you land in the “yes” pile.
The Psychology Behind Quality of Hire Decisions
The Halo Effect and First-Impression Bias
The halo effect is the most pervasive psychological driver of poor Quality of Hire outcomes: the tendency to allow one strong positive attribute (a prestigious alma mater, a well-known employer, an impressive first five minutes of conversation) to inflate the evaluator’s overall assessment of the candidate. Research consistently shows that interviewers form an overall impression within the first four minutes of an interview, and then spend the remaining time unconsciously gathering evidence to confirm that impression. The result is that interview evaluations frequently measure how well a candidate performs the impression-making moment, not how well they would perform the job itself.
Outcome Attribution and Accountability Diffusion
One of the reasons Quality of Hire is so rarely measured is that no single actor in the hiring process feels fully accountable for the outcome. The recruiter sourced the candidate; the hiring manager made the call; HR managed the process. When a hire underperforms, accountability diffuses across all three, and because accountability is diffuse, no one closes the feedback loop to understand what the decision process got wrong. Outcome accountability must be explicitly assigned, most commonly to the hiring manager, and the Quality of Hire data must flow back to that person specifically to drive meaningful behavior change.
The Rearview Mirror Problem in Hire Assessment
Most organizations assess Quality of Hire retrospectively, reviewing performance data after the fact and drawing conclusions about whether the hire was good. The limitation is temporal: by the time a bad hire is identified, the cost is already incurred. The forward-looking application of Quality of Hire measurement is predictive validation, which involves analyzing which pre-hire signals (assessment scores, interview rubric ratings, reference call themes) correlate most strongly with post-hire performance outcomes, and weighting future hiring decisions accordingly. This converts Quality of Hire from a report card into a forecasting model.
Quality of Hire vs. Related Recruitment Metrics
| Metric | What It Measures | Measurement Type | When Measured | Strategic Focus |
|---|---|---|---|---|
| Quality of Hire | Performance, retention, and value delivered | Outcome | Post-hire (12 months) | Hire effectiveness |
| Time-to-Fill | Days from requisition to accepted offer | Process | During search | Speed |
| Cost-per-Hire | Total recruitment spend per role | Process | During search | Efficiency |
| Offer Acceptance Rate | Proportion of offers accepted by candidates | Process | Offer stage | Candidate experience |
| Retention Rate | Proportion of employees staying beyond 12 months | Outcome | Post-hire | People investment |
| Hiring Manager Satisfaction | HM rating of candidate quality | Hybrid | 30/90-day check-in | Role alignment |
The critical distinction in the table above is the difference between process metrics and outcome metrics. Process metrics measure whether the recruitment machine is running well. Outcome metrics measure whether the recruitment machine is producing what the organization needs. Organizations that track only process metrics are measuring activity. Organizations that track Quality of Hire are measuring impact.
What the Experts Say?
Quality of Hire is the single metric that can unite recruiters and business leaders around a shared definition of success. Every other recruiting metric is internal to the function. Quality of Hire belongs to both the business and talent acquisition — it is the only one that measures whether the investment actually paid off.
– Lou Adler, CEO, The Adler Group; Creator of Performance-based Hiring
How to Measure Quality of Hire Effectiveness?
Formula
Quality of Hire Score = (Performance Rating + Retention Score + HM Satisfaction + Time-to-Productivity) / 4
New Hire Performance Rate (%) = (New Hires Meeting or Exceeding Performance Goals / Total New Hires) x 100
Early Attrition Rate (%) = (New Hires Who Leave Within 90 Days / Total New Hires) x 100
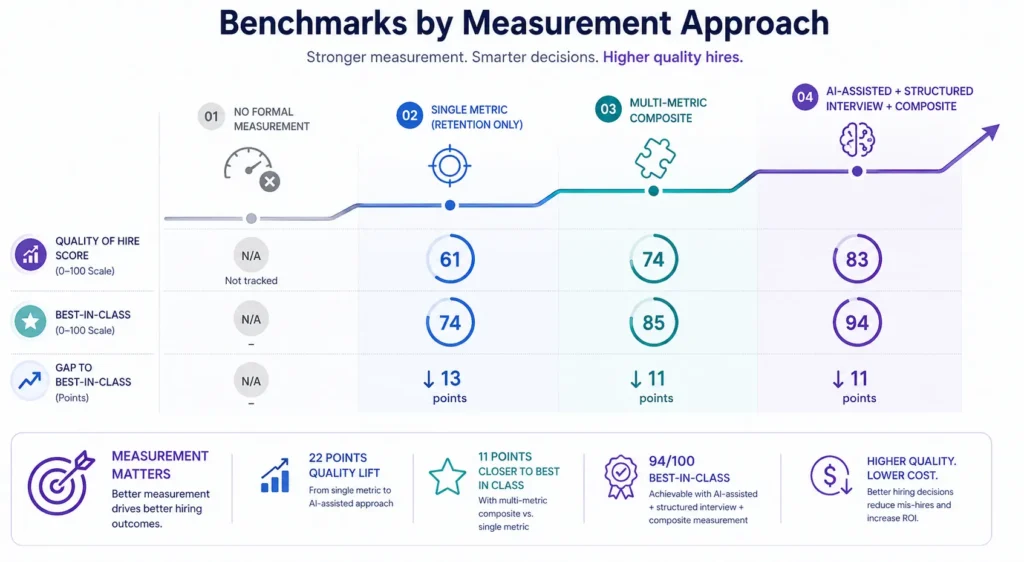
Benchmarks by Measurement Approach
| Measurement Approach | Avg. Quality of Hire Score | Best-in-Class |
|---|---|---|
| No formal measurement | Not tracked | – |
| Single metric (retention only) | 61 | 74 |
| Multi-metric composite | 74 | 85 |
| AI-assisted + structured interview + composite | 83 | 94 |
Key Strategies for Improving Quality of Hire
Avua’s platform supports Quality of Hire tracking at the role and hiring manager level, enabling TA teams to connect pre-hire signals with post-hire outcomes at the granularity required for meaningful feedback loops.
How Can AI and Automation Support Quality of Hire?
Predictive Performance Scoring
AI models trained on historical performance data can evaluate pre-hire signals (assessment scores, structured interview ratings, resume attributes, and sourcing channel data) against post-hire performance outcomes, generating a predictive performance score for current candidates based on the patterns of what has worked in the past. This predictive layer does not replace human judgment; it informs it, surfacing the signals that humans tend to over- or under-weight in their evaluations and bringing analytical rigor to decisions that are otherwise driven by intuition.
Automated Quality of Hire Surveys
AI-powered survey tools can automate the collection of Quality of Hire data at defined intervals, specifically at 30, 90, and 365 days after start date, from hiring managers, peers, and new hires themselves. Automated collection removes the operational friction that causes most manual Quality of Hire programs to atrophy within two quarters of launch, ensuring consistent data generation rather than episodic measurement.
Pattern Recognition Across Hiring Cohorts
Natural language processing tools can analyze qualitative performance review data, hiring manager feedback, and exit interview notes to identify patterns across hiring cohorts, surfacing which role profiles, sourcing channels, or interview processes are producing systematically stronger or weaker quality outcomes. This pattern recognition capability transforms Quality of Hire from a backward-looking metric into a forward-looking system that improves with every additional data point.
Structured Interview Guide Generation
AI tools can generate role-specific, competency-mapped interview guides from a brief description of the performance profile, ensuring that every hiring manager receives a structured framework before conducting an interview rather than improvising. Structured interviews are the single highest-leverage intervention for improving Quality of Hire, and AI guide generation removes the operational cost of building them from scratch for each new role.
Stop Juggling
10 Job Boards.
Search One
Your next role is already here. avua pulls opportunities from across the web into a single searchable feed; filtered by role, location, salary, and remote preference.
1.5 Million+
Active Jobs
380+
Job Categories
Quality of Hire Through the Lens of Equity and Inclusion
Defining Performance in Ways That Reflect the Whole Candidate
The way an organization defines quality in Quality of Hire determines whose contributions get measured and whose get overlooked. Performance rating systems that weight individual output over collaborative contribution, or that rely on manager discretion without calibration, consistently produce demographic disparities, rating the work styles that are most visible and most similar to the rater’s own more favorably. Quality of Hire frameworks should include explicit calibration on what performance means across different working styles and contribution types, not just the ones that reflect the existing culture’s defaults.
Sourcing Channel Quality and Representation Patterns
When Quality of Hire is measured disaggregated by sourcing channel, organizations frequently discover that their highest-quality hires do not come from their highest-volume channels. They also discover that the demographic composition of hires varies significantly by channel. Sourcing channels that produce high Quality of Hire scores and greater representation diversity are the channels that deserve investment growth, but this insight is only available to organizations actually measuring Quality of Hire at the channel level rather than in aggregate.
Structured Process as the Equitable Intervention
The most effective DEI intervention in the hiring process is also the most effective Quality of Hire intervention: structured, criteria-based evaluation applied consistently across all candidates. Organizations that implement structured interviewing and explicit rubrics not only improve their Quality of Hire scores; they also produce more demographically equitable outcomes, because structure reduces the role of evaluator subjectivity in determining who advances. The equity and quality imperatives are not in tension; they are the same intervention applied to two distinct but equally important outcomes.
Common Challenges and Solutions
| Challenge | Solution |
|---|---|
| No agreed definition of “quality” across hiring stakeholders | Conduct a role-level performance profiling session before each search; define success criteria in writing before sourcing begins |
| Quality of Hire data collected inconsistently or not at all | Automate survey delivery at 30, 90, and 365-day intervals using ATS or HRIS integration; assign explicit ownership for data collection |
| Quality of Hire scores not fed back to hiring managers | Build a quarterly hiring manager performance report correlating their interview ratings with 12-month outcomes of their hires |
| High scores masking demographic concentration | Disaggregate Quality of Hire data by sourcing channel, demographic group, and hiring manager to surface patterns invisible in aggregate |
Real-World Case Studies
Case Study 1: The Technology Scale-Up
A 300-person technology company noticed a persistent pattern: strong interview performers were underperforming at the 12-month mark, while candidates who had been less polished in interviews were outperforming expectations. They implemented a Quality of Hire measurement program tracking performance ratings, hiring manager satisfaction, and retention at 365 days, then correlated these outcomes against pre-hire signals.
The analysis revealed that the interview process was heavily weighted toward technical credential presentation, a skill that correlated weakly with actual job performance, and weakly weighted toward collaborative problem-solving, which correlated strongly. They redesigned their interview process and saw their Quality of Hire score improve from 64 to 81 over two hiring cycles.
Case Study 2: The Financial Services Firm
A mid-market financial services firm with a consistently high cost-per-hire ran a Quality of Hire analysis and discovered that 38% of their hires sourced through premium executive search firms were rated below-average performers at 12 months, while hires sourced through employee referrals at a fraction of the cost produced Quality of Hire scores 22 points higher. The analysis triggered a sourcing strategy rebalancing: referral program investment increased, the number of retained search engagements was reduced, and data-driven recruiting practices were applied to optimize channel mix. Cost-per-hire fell and Quality of Hire rose simultaneously, demonstrating that the two objectives are not in conflict when measurement is in place.
Case Study 3: The Healthcare Network
A regional healthcare network implemented a structured Quality of Hire program after noticing that employee retention rates for nursing staff hired through agency channels were significantly lower than for those hired through direct sourcing. Quality of Hire measurement confirmed the pattern and quantified it: agency-sourced nurses had 12-month retention rates of 61%, versus 84% for directly sourced nurses.
The Quality of Hire data made what had been debated as a sourcing cost question into a retention outcome question with clear financial stakes. Direct sourcing investment increased, agency spend decreased, and 12-month retention improved to 79% within one hiring cycle.
Performance Signals Every Quality of Hire Framework Should Monitor
Quality of Hire Across the Talent Lifecycle
Pre-Hire: Defining the Performance Profile
Quality of Hire improvement begins before sourcing starts. The most consequential pre-hire action is defining what success in the role looks like at 30, 90, and 365 days, and using that performance profile to design the sourcing strategy, the assessment criteria, and the interview framework. A hiring plan built around a performance profile produces a fundamentally different search than one built around a credential list, and the difference shows up in Quality of Hire outcomes six months after the hire joins the organization.
During Hiring: Structured Evaluation and Data Collection
The hiring process itself is the primary Quality of Hire lever: structured interviews, validated assessments, and calibrated evaluation rubrics generate the pre-hire signal data that Quality of Hire measurement depends on. Organizations that skip this infrastructure, conducting unstructured interviews and making intuitive decisions, cannot improve their Quality of Hire scores because they have no data connecting their process choices to their outcome results.
Post-Hire: Measurement and Feedback Loops
The 30, 90, and 365-day check-ins are where Quality of Hire data is generated. These data points must flow back to the talent acquisition function and must be connected to the pre-hire signals for each hire. The candidate pipeline that produced the hire, the sourcing channel that surfaced the candidate, and the interview ratings that cleared them all need to be part of the Quality of Hire record for the feedback loop to function as designed.
Continuous Improvement: From Report Card to Forecasting Model
The most mature application of Quality of Hire measurement is predictive: using historical correlations between pre-hire signals and post-hire outcomes to forecast the expected Quality of Hire of current candidate pools before offers are made. Organizations operating at this level treat Quality of Hire not as an evaluation of what happened but as a real-time calibration of what is about to happen, enabling intervention before a poor hire is made rather than after.
The Real Cost of Ignoring Quality of Hire
| Scenario | Bad Hire Rate | Annual Cost (40 hires/year, $90K avg. base) | QoH Score |
|---|---|---|---|
| No measurement, no structure | 22% | $267,000+ | Not tracked |
| Basic measurement, unstructured interviews | 15% | $182,000 | 61-67 |
| Composite measurement, structured process | 9% | $109,000 | 74-82 |
| AI-assisted, structured, closed-loop feedback | 5% | $61,000 | 83-94 |
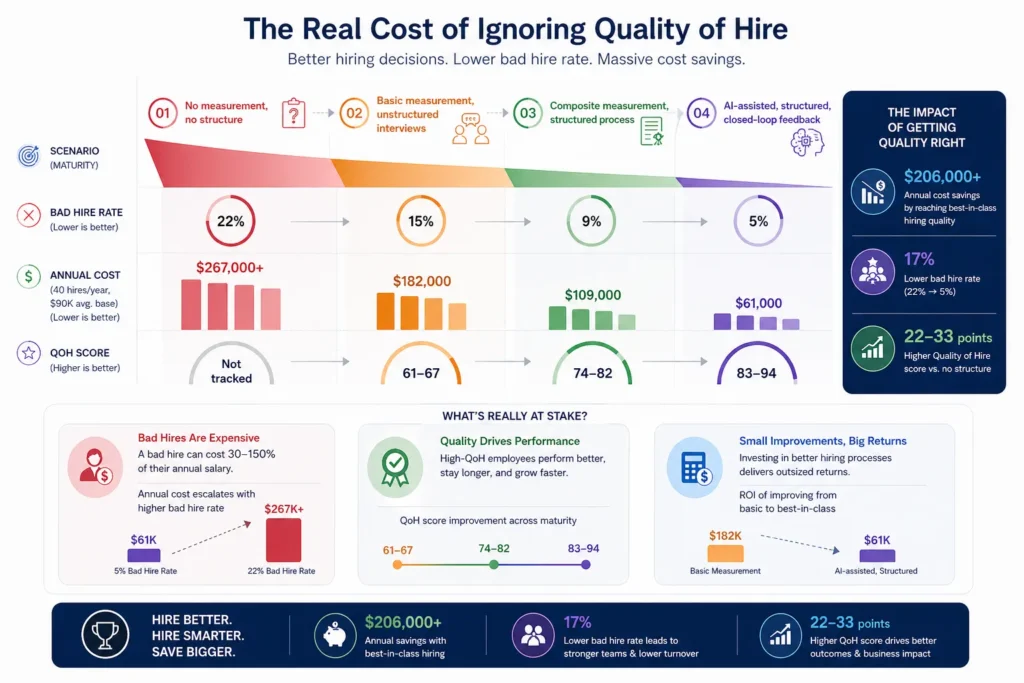
Bad hire cost estimated at 30% of base salary per instance, covering replacement, onboarding, and productivity loss.
Related Terms
| Term | Definition |
|---|---|
| Hiring Manager Quality of Hire Score | The ratio of a specific hiring manager’s hires’ average 12-month performance to the organizational benchmark |
| Structured Interview | An interview format using predefined, consistently applied questions evaluated against explicit criteria to improve predictive accuracy |
| Performance Profile | A pre-hire document defining what success in a role looks like at 30, 90, and 365 days, used to align sourcing and evaluation |
| Predictive Validity | The statistical relationship between a pre-hire assessment or process and subsequent post-hire performance outcomes |
| Early Attrition | Voluntary or involuntary departure within the first 90 days of employment, often indicative of expectation mismatch in the hiring process |
Frequently Asked Questions
What components make up a Quality of Hire score?
The most commonly used components are performance rating at 12 months, retention status, hiring manager satisfaction, and time-to-full-productivity. Organizations may also include cultural contribution scores, peer feedback, and role-specific competency assessments. The components should be selected based on what the organization can measure consistently, not on what is theoretically comprehensive.
How is Quality of Hire different from retention rate?
Retention rate measures whether an employee stayed. Quality of Hire measures whether an employee stayed and performed well. An organization with high retention but low performance ratings has a Quality of Hire problem that retention data alone would never surface. Retention is one component of Quality of Hire, not a proxy for the full metric.
How long does it take to see Quality of Hire improvements after changing the hiring process?
Most organizations see measurable improvement within two to four hiring cycles, roughly six to twelve months, after implementing structured interviewing, validated assessments, and closed-loop feedback. The improvement compounds: early cycles generate the data that calibrates the system for later cycles, so the gains accelerate over time.
Can Quality of Hire be measured for all role levels?
Yes, though the components and benchmarks vary by level. For individual contributor roles, time-to-productivity and performance ratings at 90 days are the most useful signals. For senior roles, 12-month performance data combined with hiring manager satisfaction and peer feedback produces the most meaningful composite. The measurement framework should be calibrated to the role’s complexity and the organization’s capacity to collect data consistently.
Does a high Quality of Hire score mean the recruitment process was cost-effective?
Not necessarily. Quality of Hire measures outcome quality, not process efficiency. A high-quality hire made through an expensive executive search process may have an excellent Quality of Hire score and a high cost-per-hire simultaneously. The relevant question is whether the cost of the process was justified by the quality of the outcome, which requires measuring both dimensions, not just one.
Conclusion
Quality of Hire is the metric that makes talent acquisition accountable for what it actually exists to produce: the right people, performing well, staying long enough to deliver the business value the organization hired for. Organizations that track only process metrics are optimizing a machine without measuring its output.
Those that build Quality of Hire measurement into the core of their talent function, with structured pre-hire processes, consistent data collection, and closed-loop feedback from performance back to process, consistently outperform those that do not across every dimension that matters to the business. The measurement infrastructure is not complex to build.
The discipline to use it is what separates the organizations that talk about hiring quality from those that actually know what theirs is.