Hiring great people is only half the job.
Keeping them is the part that most organisations underinvest in until the exit interviews start telling a story they did not see coming.
Retention rate is the metric that holds a mirror up to how well an organisation is actually doing at the part of talent management that happens after the offer is signed.
Retention rate is the percentage of employees who remain with an organisation over a defined period, and it is one of the clearest indicators of workforce health available to HR teams. A strong retention rate signals that people are finding value, growth, and enough reason to stay. A declining one is rarely about salary alone, it surfaces deeper issues in employee experience, employee engagement, and how well the organisation is delivering on the promises made during hiring.
For HR teams, retention rate sits alongside attrition rate as a paired diagnostic, two sides of the same workforce stability picture. Tracking both over time, broken down by department, tenure, and role level, turns a single percentage into a genuinely actionable dataset that feeds directly into HR analytics and workforce planning decisions.
The core metric is the Employee Retention Rate, measured over a defined period using a formula that excludes new hires from the denominator to capture true organizational stability rather than headcount churn.
Retention Rate (%) = ((Employees at End of Period - New Hires During Period) / Employees at Start of Period) × 100
High-performing organizations sustain Employee Retention Rates of 90% or above. The US national average across all industries sits at approximately 77%, according to Bureau of Labor Statistics data. The gap between average and best-in-class is not explained by sector or scale, it is explained by the quality of hiring decisions, onboarding investment, management capability, and the organizational conditions that make experienced employees choose to stay.
What is Retention Rate?
Employee retention rate is a quantitative measure of workforce stability, the proportion of employees who remain with an organization during a defined period, calculated in a way that isolates genuine retention from headcount fluctuation caused by new hiring activity. Retention rate is distinct from its close cousin, the attrition rate. Attrition rate measures the proportion of employees who leave; retention rate measures those who stay. Both are useful, but retention rate is the more strategically meaningful figure because it directly reflects the organization’s ability to hold onto the people it has invested in developing, and provides the denominator context for interpreting voluntary departure patterns.
The retention rate is also a composite metric masking significant variation within its single number. An organization with an 85% overall retention rate may have 95% retention among its highest performers and 65% retention among its mid-level technical specialists, a distribution that tells a completely different story from the headline figure. Retention rate analysis that does not segment by performance tier, role family, tenure band, and management unit is providing aggregated comfort, not actionable intelligence.
Why Retention Rate Is a Game-Changer for Sustainable Workforce Strategy?
The conversation about employee retention rate in most organizations is reactive. Someone notices the turnover number has increased, leadership expresses concern, HR launches an exit interview programme, and a set of action items circulates that will be partially implemented before the next crisis displaces them. This reactive posture is expensive. The organizations that treat retention rate as a leading strategy metric, monitored continuously, segmented granularly, and connected causally to their talent acquisition and development practices, achieve dramatically better workforce economics than those that treat it as a lagging indicator of problems they discover after the departures have already occurred.
The financial case begins with a number that most organizations significantly undercount. The visible cost of an employee departure is straightforward: the replacement cost, typically calculated as 50-200% of annual salary. A mid-level engineer earning $120,000 who leaves costs the organization $60,000 to $240,000 to replace, depending on the specialization, the time-to-fill, and the productivity loss during the vacancy. But the less-visible costs are often larger: the institutional knowledge that leaves with the departing employee, the team disruption that follows, the reduced productivity of the remaining team during the transition period, and the employer brand signal that departure patterns send to the broader talent market.
The math becomes stark at scale. A 200-person company with an 80% retention rate, losing 40 employees per year, and an average replacement cost of $50,000 per departing employee is spending $2 million annually on turnover costs. Moving that retention rate to 90%, retaining 20 additional employees per year, saves $1 million annually, net of whatever retention investment produced the improvement. Few talent strategy investments deliver that return profile.
According to Gallup’s State of the Global Workplace research, organizations in the top quartile of employee engagement, the primary behavioural predictor of retention, experience 43% lower attrition than those in the bottom quartile. And the causal chain runs in both directions: high retention produces higher engagement (employees who stay longer build deeper relationships, greater mastery, and stronger commitment), while high engagement produces higher retention. The organizations that break into the high-retention, high-engagement dynamic outperform industry averages on both people metrics and financial outcomes simultaneously.
For HR leaders, the strategic implication is that employee retention rate is not an HR metric, it is a business performance metric that happens to be measured by HR. Every percentage point improvement in retention rate directly reduces replacement cost, accelerates team productivity, improves institutional knowledge depth, and strengthens employer brand with future candidate populations. Treating it as anything less significant than a revenue metric is an underinvestment in the workforce economics that determine whether the organization can execute its strategy.
A concrete scenario illustrates the opportunity: a professional services firm with 150 employees and a 75% retention rate commissions a retention analysis. Segmented data reveals that retention among employees in their first two years of tenure is 61%, significantly below the firm average, and that 70% of early-tenure departures happen within 90 days of managers switching roles.
The root cause is not pay or culture; it is management transition quality. The intervention, a structured manager transition protocol with explicit 30-60-90 day handoff requirements, costs $15,000 in design and training investment and produces an increase in two-year retention from 61% to 78%. The modelled financial impact of the retention improvement: $890,000 in avoided replacement costs in the first year alone.
Your Resume Isn’t Getting Read
Let’s Get That Fixed!
75% of resumes get auto-rejected. avua’s AI Resume Builder optimizes formatting, keywords, and scoring in under 3 minutes, so you land in the “yes” pile.
The Psychology Behind Retention Rate
Psychological Safety and the Decision to Stay
The single strongest predictor of voluntary employee retention is psychological safety: the degree to which employees believe they can speak up, take risks, and be authentic at work without fear of punishment or humiliation. Amy Edmondson’s foundational research at Harvard Business School, and subsequent replication studies, consistently identify psychological safety as the primary environmental condition that predicts both high performance and low voluntary turnover.
Employees in psychologically safe environments do not leave for marginally higher compensation at competitors, they are too invested in the quality of the work relationships and the permission to grow. Organizations serious about improving their retention rate need to measure and develop psychological safety at the team level, not just at the organizational level where it averages out into meaninglessness.
Loss Aversion and the Decision to Stay or Leave
Loss aversion, the tendency to weigh potential losses more heavily than equivalent potential gains, operates in both directions on voluntary retention decisions. An employee considering a departure is simultaneously evaluating the gains of the new opportunity (higher compensation, better title, new challenge) against the losses of leaving (relationships, status, certainty, institutional knowledge value).
Retention strategies that proactively address the loss side of this calculation, by increasing the value of what employees would give up by leaving, through deliberate relationship investment, role enrichment, and career development visibility, are more effective than those that focus only on compensation matching, which only addresses one dimension of a multi-factor decision.
Identity and Belonging as Retention Drivers
Employees who have developed a strong organizational identity, who see membership in the organization as a meaningful part of how they define themselves professionally, leave at dramatically lower rates than those for whom the organization is primarily a transactional employment relationship.
This identity connection is built through meaningful work, visible contribution to organizational purpose, professional recognition, and the quality of team belonging. Organizations that actively cultivate organizational identity, through mission clarity, recognition systems, community investment, and leadership visibility, build retention infrastructure that outperforms compensation-led retention strategies in both cost efficiency and longevity.
Retention Rate vs. Related Workforce Metrics
| Metric | What It Measures | Formula | Typical Use Case |
|---|---|---|---|
| Employee Retention Rate | Proportion of employees who stay | ((End – New Hires) / Start) × 100 | Overall workforce stability |
| Attrition Rate | Proportion of employees who leave | (Leavers / Avg. Headcount) × 100 | Turnover trend analysis |
| Voluntary Turnover Rate | Employees who chose to leave | (Voluntary Departures / Avg. Headcount) × 100 | Culture and engagement health |
| Employee Engagement Score | Emotional commitment to the organization | Survey-based composite index | Predictive retention indicator |
| eNPS (Employee Net Promoter Score) | Likelihood to recommend the organization | % Promoters minus % Detractors | Employer brand and advocacy health |
The critical distinction between retention rate and attrition rate is not just mathematical inversion, it is strategic focus. Attrition rate focuses attention on who is leaving and why; retention rate focuses attention on what conditions are keeping people engaged and committed. Both are necessary, but organizations that track only attrition are perpetually in reactive mode, while those that track retention rate against segmented benchmarks can identify and address conditions before they produce departures.
What the Experts Say?
Retention is not an HR programme. It is the output of a hundred small decisions made every day by managers, leaders, and the organization’s systems, about who gets recognized, who gets developed, who gets heard, and who gets left behind. The retention rate tells you the score. The work is in understanding what produced it.
– Jacob Morgan, Author of The Employee Experience Advantage; Future of Work Researcher
How to Measure Retention Rate Effectively?
Formula
Overall Retention Rate (%) = ((Employees at End of Period - New Hires During Period) / Employees at Start of Period) × 100
Voluntary Retention Rate (%) = ((Employees at End - New Hires - Involuntary Separations) / Employees at Start) × 100
Regrettable Loss Rate (%) = (High-Performer Departures / Total Departures) × 100
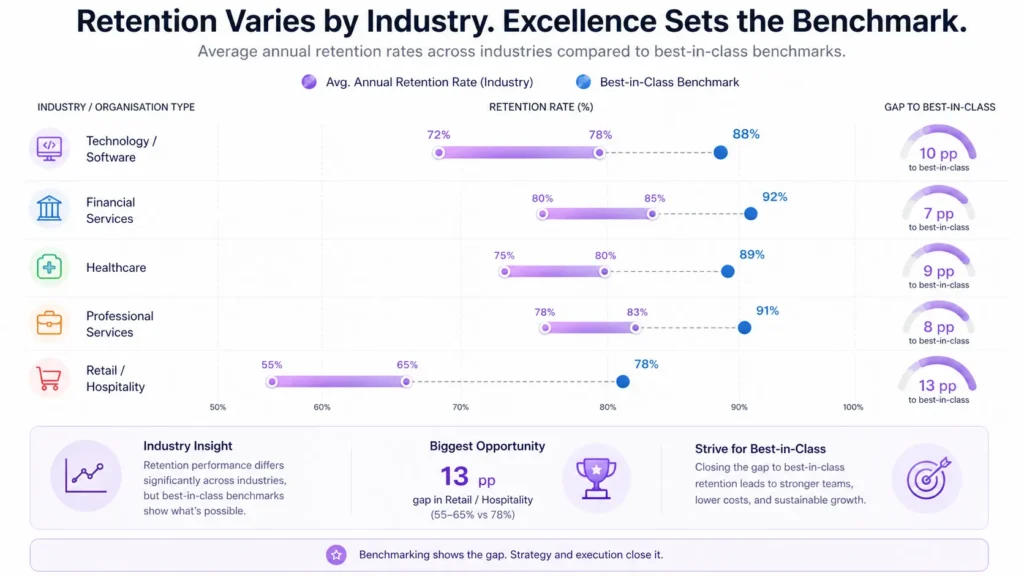
Benchmarks by Industry and Organization Type
| Organization Type | Avg. Annual Retention Rate | Best-in-Class |
|---|---|---|
| Technology / Software | 72-78% | 88% |
| Financial Services | 80-85% | 92% |
| Healthcare | 75-80% | 89% |
| Professional Services | 78-83% | 91% |
| Retail / Hospitality | 55-65% | 78% |
Key Strategies for Improving Retention Rate
How Can AI and Automation Support Retention Rate Management?
Predictive Attrition Modeling
Machine learning models trained on employee tenure data, engagement scores, performance ratings, compensation positioning, manager tenure, and career progression velocity can predict which employees have elevated attrition risk in the next 6-12 months, with meaningful accuracy. This predictive attrition modeling converts retention management from reactive (responding to resignations) to proactive (intervening before the departure decision is made). Organizations using predictive attrition models report 18-25% lower voluntary turnover rates than those without, because retention interventions are targeted at the right employees at the right moment.
Engagement Signal Detection
AI platforms that analyze passive data signals, response rates to internal communications, collaboration network changes, performance trajectory shifts, meeting attendance patterns, and participation in optional activities, can identify declining engagement before it surfaces in a resignation. These engagement signals provide a leading indicator layer that traditional annual engagement surveys cannot deliver, because they are continuous and individual-level rather than periodic and aggregate.
Exit Interview Pattern Analysis
Natural language processing tools applied to exit interview data, including both structured responses and open-text comments, identify the language patterns, theme clusters, and sentiment trajectories that predict voluntary departures across different employee segments. This exit interview analysis at scale reveals systemic retention risk factors that individual exit conversations make visible only one at a time, enabling structural interventions rather than individual-case responses.
Compensation Benchmarking and Pay Equity Analysis
AI-powered compensation intelligence tools continuously monitor market salary data and flag employees whose compensation has drifted below market positioning, a primary trigger of voluntary departure in high-competition talent segments. This real-time compensation benchmarking enables proactive pay equity correction before compensation becomes a resignation driver, rather than discovering the issue during a counter-offer conversation that is often already too late.
Stop Juggling
10 Job Boards.
Search One
Your next role is already here. avua pulls opportunities from across the web into a single searchable feed; filtered by role, location, salary, and remote preference.
1.5 Million+
Active Jobs
380+
Job Categories
Retention Rate and Equitable Hiring Practices
Differential Retention Across Employee Groups
Employee retention rate is rarely uniform across demographic groups within an organization, and the gaps are rarely accidental. Research consistently finds that employees from underrepresented groups leave organizations at higher rates than the general workforce, and that the primary drivers are not compensation but belonging, psychological safety, advancement equity, and the daily experience of organizational inclusion. Organizations that track retention rate segmented by demographic group identify these gaps as a starting point for structural investigation, rather than attributing differential retention to individual preference or coincidence.
Promotion Equity and Mid-Career Retention
One of the strongest predictors of differential retention among underrepresented employees is promotion equity: whether employees from different demographic groups advance at equivalent rates when controlling for performance and tenure. Organizations where promotion rates are significantly lower for specific groups produce predictable attrition patterns in the second and third year of tenure, the point at which employees who have not advanced despite strong performance draw the reasonable conclusion that advancement is not available to them here. Tracking promotion rates alongside retention rates, segmented by demographic group, identifies this dynamic before it produces significant talent loss.
Inclusive Management and Retention Infrastructure
The manager is the most significant controllable variable in individual employee retention, and the manager’s inclusive leadership capability is the most significant variable in differential retention across demographic groups. Managers who create genuinely inclusive team environments, where all team members receive equivalent access to development opportunities, feedback quality, high-visibility assignments, and psychological safety, produce more equitable employee engagement scores and more equitable retention outcomes. Investing in inclusive management capability is both a DEI intervention and a retention strategy, and it should be evaluated as both.
Common Challenges and Solutions
| Challenge | Solution |
|---|---|
| Retention rate declining without clear causal explanation | Implement segmented retention analysis by manager, role family, and tenure band to isolate where attrition is concentrated before designing interventions |
| High-performer retention specifically deteriorating | Conduct targeted stay interviews with current high performers to identify early departure signals; review compensation positioning and career development visibility for this population |
| Retention investment difficult to justify to finance without ROI model | Build a turnover cost model using actual replacement cost data from recent departures; present retention investment against modelled cost savings at specific retention rate improvement targets |
Real-World Case Studies
Case Study 1: The Professional Services Firm
A 400-person professional services firm identified through segmented retention analysis that their overall 81% retention rate masked a 64% retention rate among employees in their second year of tenure. Exit interview data analysis revealed a consistent theme: employees in year two could not see a clear path to the next level and were not having proactive career development conversations with their managers.
The firm implemented a mandatory 18-month career conversation protocol, a structured one-to-one focused exclusively on growth and development, separate from performance reviews, for all employees reaching the 18-month tenure mark. Two-year retention improved from 64% to 79% within three cohort cycles. The intervention cost approximately $22,000 in training and process design; the modelled annual retention cost saving exceeded $380,000.
Case Study 2: The Technology Company
A SaaS technology company found that their engineering team’s retention rate was 69%, significantly below both their overall company rate of 82% and the market benchmark for their sector. Predictive attrition modelling applied to their people data identified two primary attrition risk factors: tenure with the same direct manager exceeding 18 months without a structured role evolution conversation, and compensation percentile position falling below the 40th market percentile.
They implemented a bi-annual compensation review for all engineering roles against live market data and introduced a structured role-evolution conversation requirement for managers at the 12-month employee mark. Engineering retention improved to 81% over two years, and the cost of the compensation investment was offset by a 34% reduction in engineering recruitment spend.
Case Study 3: The Retail Organization
A national retail chain with 2,000 front-line employees and a 58% annual retention rate, typical for the sector but significantly impacting their operations and customer service quality, redesigned their employee onboarding experience based on exit interview data showing that 47% of departing employees in their first 90 days cited “didn’t feel connected to the team or the role” as a primary factor.
The redesigned onboarding introduced a structured 90-day connection programme pairing new hires with a peer buddy, a manager check-in cadence, and a 30-day role clarity conversation. First-90-day retention improved from 72% to 84%. Extrapolated across annual hiring volume, the improvement reduced annual recruitment spend by approximately $340,000.
Essential Performance Indicators for Retention Rate Success
Retention Rate Across the Talent Lifecycle
Hiring: Retention Begins at the Interview Stage
The most powerful retention investment an organization can make is also the most underappreciated: hiring the right people in the first place. Candidates hired for genuine role fit, clear growth alignment, and realistic expectations of the role and culture retain at materially higher rates than those hired through credential match and compensation offer alone. The organizations that connect their hiring plan design to 12-month retention outcomes, and feed that retention data back into screening criteria and interview calibration, are investing in retention before the employee’s first day.
Onboarding: The 90-Day Retention Window
The first 90 days after joining are the highest attrition-risk period for most employees across most roles. This is when the gap between the experience sold during recruitment and the reality of the role becomes undeniable, and when employees decide whether to invest in the organization or begin a quiet exit process. Structured onboarding that provides role clarity, team connection, manager access, and early win opportunities has a direct, measurable impact on 90-day and 12-month retention rates. Brandon Hall Group research finds that strong onboarding improves new hire retention by 82% and productivity by over 70%.
Development: The Mid-Tenure Retention Inflection
Between 18 months and four years, employees reach a retention inflection point: they are experienced enough to be highly productive, connected enough to be effective, and developed enough to be attractive to competitors. This is the tenure segment with the highest voluntary attrition risk in most organizations, and the segment most responsive to deliberate career development investment. Visible growth pathways, internal mobility opportunities, and the consistent quality of development conversations with managers are the primary retention tools for this segment, more effective, and far more cost-efficient, than reactive compensation matching after a competing offer arrives.
Long-Tenure: Retaining the Institutional Knowledge Carriers
Employees with five or more years of tenure represent the organization’s institutional knowledge infrastructure, the accumulated understanding of how things work, who to call, what has been tried, and why certain decisions were made. Their departure costs more than a replacement calculation captures. Retaining long-tenure employees requires different strategies from early-tenure retention: recognition of accumulated contribution, evolving role scope, opportunities to mentor and develop others, and connection to strategic direction. The organizations that invest in long-tenure employee experience as deliberately as they invest in new hire onboarding build workforce stability that compounds over time.
The Real Cost of Poor Retention Rate Management
| Scenario | Annual Retention Rate | Annual Departures (200-person org) | Estimated Annual Turnover Cost |
|---|---|---|---|
| Below-average retention | 72% | 56 employees | $1,680,000 |
| Industry-average retention | 80% | 40 employees | $1,200,000 |
| High-performing retention | 90% | 20 employees | $600,000 |
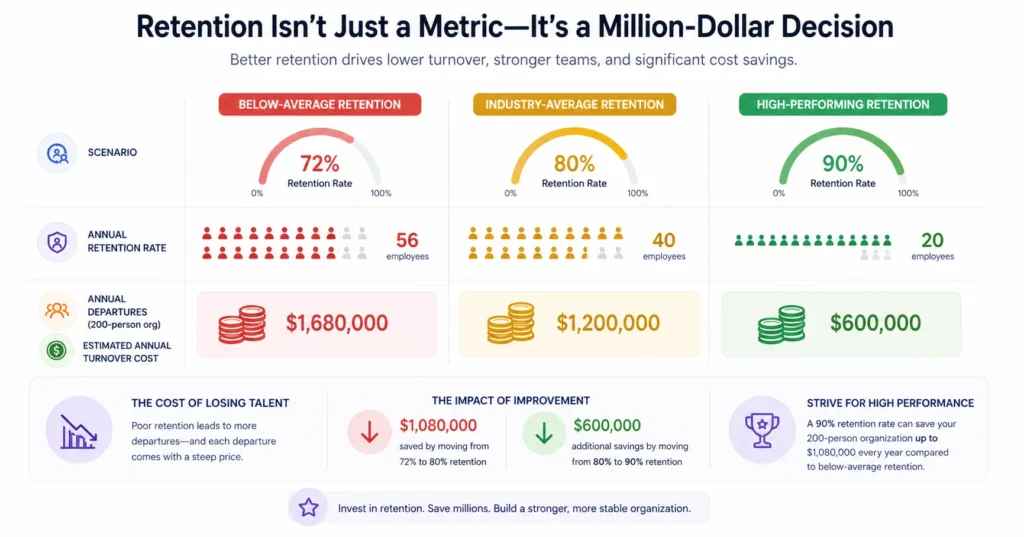
Replacement cost estimated at $50,000 per departing employee across recruitment, onboarding, and productivity loss. Improvement from average to high-performing retention saves approximately $600,000 annually in a 200-person organization.
Related Terms
| Term | Definition |
|---|---|
| Attrition Rate | The proportion of employees who leave an organization during a defined period, expressed as a percentage of average headcount |
| Employee Engagement | The degree of emotional commitment and discretionary effort employees invest in their work and organization |
| Voluntary Turnover | Departures initiated by the employee rather than the organization, reflecting pull factors in the external market and push factors in the current role |
| Employee Net Promoter Score (eNPS) | A measure of the proportion of employees who would recommend the organization as a place to work, used as a proxy for engagement and retention health |
| Onboarding | The structured process of integrating new employees into an organization, covering orientation, role clarity, team connection, and early performance support |
Frequently Asked Questions
How is employee retention rate calculated?
The standard formula is: ((Employees at End of Period – New Hires During Period) / Employees at Start of Period) × 100. Excluding new hires from the denominator isolates genuine retention from headcount movement, providing a cleaner measure of how well the organization is holding onto its existing workforce.
What is a good employee retention rate?
This depends significantly on industry. Technology companies aim for 85-90%+. Healthcare and professional services benchmark at 80-88%. Retail and hospitality, with structurally higher turnover, consider 70%+ strong. The most meaningful benchmark is your own historical trend and how it compares to direct industry peers rather than cross-sector averages.
What is the difference between retention rate and attrition rate?
Retention rate measures the proportion of employees who stay during a period. Attrition rate measures the proportion who leave. Both derived from the same underlying data, they provide complementary perspectives: retention rate tells you how stable your workforce is; attrition rate tells you how much replacement activity your organization needs to manage.
What are the main drivers of low employee retention?
Research consistently identifies the primary voluntary departure drivers as: insufficient career development visibility, poor direct manager relationship quality, compensation below market positioning, limited flexibility in how and where work is performed, and absence of psychological safety. Exit interview data segmented by departure reason reveals which of these are most relevant in a specific organizational context.
How does hiring quality affect retention rate?
Significantly. Candidates hired with realistic expectations, genuine role fit, and alignment between their development goals and the organization’s growth opportunities retain at materially higher rates than those hired primarily on credential match and immediate need. Tracking retention rate by hiring cohort and hiring criteria reveals which hiring decisions produce durable workforce investments.
Conclusion
Employee retention rate is the measure that most directly reflects whether an organization’s talent strategy is working as an integrated system, whether hiring decisions, onboarding investment, manager development, compensation management, and career development are collectively producing an environment where experienced, capable people choose to stay and grow.
The organizations treating retention rate as a lagging indicator of problems they discover after the fact are perpetually in a replacement cycle that compounds in cost and capability loss. Those that treat it as a leading performance metric, monitored granularly, connected causally to talent practices, and improved systematically through targeted intervention, build workforce stability that translates directly into operational performance, cultural depth, and competitive talent advantage. The cost of a departure is always higher than the cost of the retention investment that could have prevented it.
Measure accordingly.