Every organization measures things. Very few organizations measure the right things. The difference between a metric, a number that exists because it is easy to calculate, and a KPI, a number that exists because it tracks progress toward a specific goal, is the difference between an organization that is busy with data and one that is guided by it. In the HR and recruiting context, that difference is especially consequential, because the field is simultaneously awash in available metrics and starved of genuine insight.
A KPI (Key Performance Indicator) is a quantified measure of performance against a specific, strategically defined goal, selected because of its direct relationship to an outcome the organization is explicitly trying to achieve, tracked over time to reveal performance trends and inform decisions, and distinguished from the broader category of metrics by its strategic significance, measurability, and actionability.
In recruiting and HR specifically, the KPI space is dense and frequently confused. Organizations that track 25 recruiting metrics are often measuring fewer true KPIs than organizations that track eight, because the difference between a metric and a KPI is not volume, it is connection to a goal.
Time-to-fill is a metric; time-to-fill measured against a target that is connected to a business impact model is a KPI. Cost per hire is a metric; cost per hire tracked against a benchmark that reflects the organization’s sourcing investment thesis is a KPI. The number is the same in both cases, the goal connection is what makes it a KPI.
AI-powered hiring platforms like avua embed KPI tracking directly into hiring workflows, providing real-time visibility into time-to-fill, source-of-hire quality and candidate conversion rates at the moment decisions are being made rather than in retrospective reports.
The core meta-metric governing KPI program quality is KPI Signal Rate: the proportion of tracked KPIs that have produced actionable decisions in the current reporting period.
KPI Signal Rate (%) = (KPIs That Informed a Documented Decision ÷ Total Active KPIs) × 100
A KPI program with a Signal Rate below 30% is tracking vanity metrics, not performance indicators. Best-in-class analytics programs maintain Signal Rates above 65%, meaning most of their KPIs are regularly informing decisions, not sitting in dashboards.
What is a KPI in HR and Recruiting?
A KPI in the HR and recruiting context is a quantified measure of performance against a specific talent acquisition, workforce management, or employee experience goal, selected for its direct connection to business outcomes, tracked with defined targets and timeframes, and used to guide decisions rather than merely to describe the current state.
The “Key” in Key Performance Indicator is the most important word. Organizations that track every available metric as if each were equally important have not identified KPIs, they have built comprehensive reporting. KPIs are the small number of measures that most directly reflect whether the HR and recruiting function is achieving its purpose.
Are Your HR KPIs Driving Decisions or Filling Dashboards?
The honest answer for most HR and TA teams is: a combination of both, with dashboards getting the larger share. HR and recruiting KPI programs have a well-documented pathology: they begin as purposeful performance management tools and gradually accumulate metrics that no longer serve a decision-making purpose but remain on the dashboard because removing them feels like hiding information.
The result is a reporting infrastructure that consumes significant time to maintain and produces limited behavioral change, because the volume of indicators has diluted the signal quality of each individual one. When everything is important, nothing is prioritized. When a dashboard contains 35 metrics, the three that actually require attention are buried in context.
The data on KPI program effectiveness is illuminating. Gartner’s research on HR analytics programs found that organizations with fewer than 12 actively managed KPIs made HR decisions informed by analytics data 47% more frequently than those with 20 or more tracked metrics. The inverse relationship between metric volume and decision quality is robust: more metrics correlate with more reporting activity and less analytical focus.
The practical mechanism is familiar to anyone who has attended a monthly recruiting report review: when the deck covers 20 metrics, the meeting spends 80% of its time describing what happened and 20% deciding what to do about it. When the review covers 6 high-signal KPIs, the ratio inverts.
A concrete scenario: a talent acquisition team tracks 28 metrics monthly, a comprehensive view of their performance across every dimension of the recruiting process. Of those 28, an audit finds that only 6 have ever produced a documented decision change: time-to-fill for critical roles, qualified application rate by posting channel, offer acceptance rate, quality-of-hire score, cost-per-hire by role tier, and recruiter capacity utilization. The remaining 22 are tracked, reported, and reviewed without ever producing a specific action.
The team spends approximately 40 hours per month on the full reporting suite. Moving to a 6-KPI dashboard reduces that to 12 hours, and concentrates the remaining analytical attention on the indicators that actually drive improvement.
The ROI case for KPI rationalization is precisely backwards from the instinct: stripping down to fewer, better-connected indicators produces more analytical value, not less, because it concentrates attention and enables the depth of analysis that surface-level monitoring of many metrics precludes.
Your Resume Isn’t Getting Read
Let’s Get That Fixed!
75% of resumes get auto-rejected. avua’s AI Resume Builder optimizes formatting, keywords, and scoring in under 3 minutes, so you land in the “yes” pile.
The Psychology Behind KPI Design and Use
Measurement Fixation and Goodhart’s Law
Goodhart’s Law, “when a measure becomes a target, it ceases to be a good measure”, is one of the most consistently observed phenomena in KPI management. When organizations set time-to-fill targets, recruiters learn to mark roles as filled before onboarding is complete to meet the metric. When offer acceptance rate is tracked, teams learn to extend offers only to candidates who have pre-committed, inflating the rate without improving the underlying process. KPI design should anticipate and counter Goodhart’s Law by measuring outcomes that are difficult to game, like quality-of-hire at 12 months, alongside process metrics that are more easily manipulated.
Attribution Complexity and KPI Ownership
In HR and recruiting, outcomes are rarely attributable to a single function or individual. Quality-of-hire is jointly influenced by sourcing quality, evaluation quality, hiring manager decision quality, and post-hire onboarding quality. Assigning this KPI to a single owner creates accountability without control and motivates protective behavior rather than collaborative improvement. KPI ownership models should reflect the reality of multi-function influence on outcomes, with collective accountability for outcomes and individual accountability for contributions.
Recency Bias in KPI Interpretation
KPI review meetings are vulnerable to recency bias: recent period performance is over-weighted relative to trend data, and single-period anomalies are interpreted as trend shifts. A recruiter who had an exceptional month is assessed as having made a structural improvement; one who had a difficult month is assessed as having a systematic problem. Requiring trend analysis (rolling averages, period-over-period comparisons) as a standard component of KPI review reduces recency bias and improves the quality of analytical conclusions.
Recruiting and HR KPIs vs. Metrics
| Category | Example | Is It a KPI? | What Makes It a KPI or Not |
|---|---|---|---|
| Recruiting speed | Time-to-fill | KPI if tied to business impact target | A target that reflects actual business consequence (project delay, vacancy cost) |
| Cost efficiency | Cost-per-hire | KPI if tied to sourcing strategy | Must connect to a sourcing investment thesis, not just be tracked |
| Quality | Quality-of-hire score | Strong KPI candidate | Directly tied to business value of hiring decisions |
| Volume | Number of applications | Metric, not KPI | Volume without quality context drives wrong behavior |
| Process | Recruiter utilization | Supporting metric | Useful context; rarely a standalone KPI |
| Retention | 90-day attrition rate | KPI if tracked by source and HM | Process-accountability connection makes it a KPI |
What the Experts Say?
The question is not ‘what can we measure?’, it’s ‘what should we be held accountable for?’ Those are very different lists. The first list is everything. The second is the six or eight things that most directly represent whether talent acquisition is doing its job.
– Madeline Laurano, Founder, Aptitude Research
Core HR and Recruiting KPIs: Measurement Frameworks
Formula Reference Set
Time-to-Fill (days) = Offer Acceptance Date − Requisition Approved Date
Cost-Per-Hire ($) = (Total Recruiting Spend in Period) ÷ (Total Hires in Period)
Quality-of-Hire Score = (Avg. Performance Rating of New Hires ÷ Org Avg. Performance Rating) × 100
Offer Acceptance Rate (%) = (Accepted Offers ÷ Total Offers Extended) × 100
Sourcing Channel ROI = (Hires from Channel) ÷ (Spend on Channel)
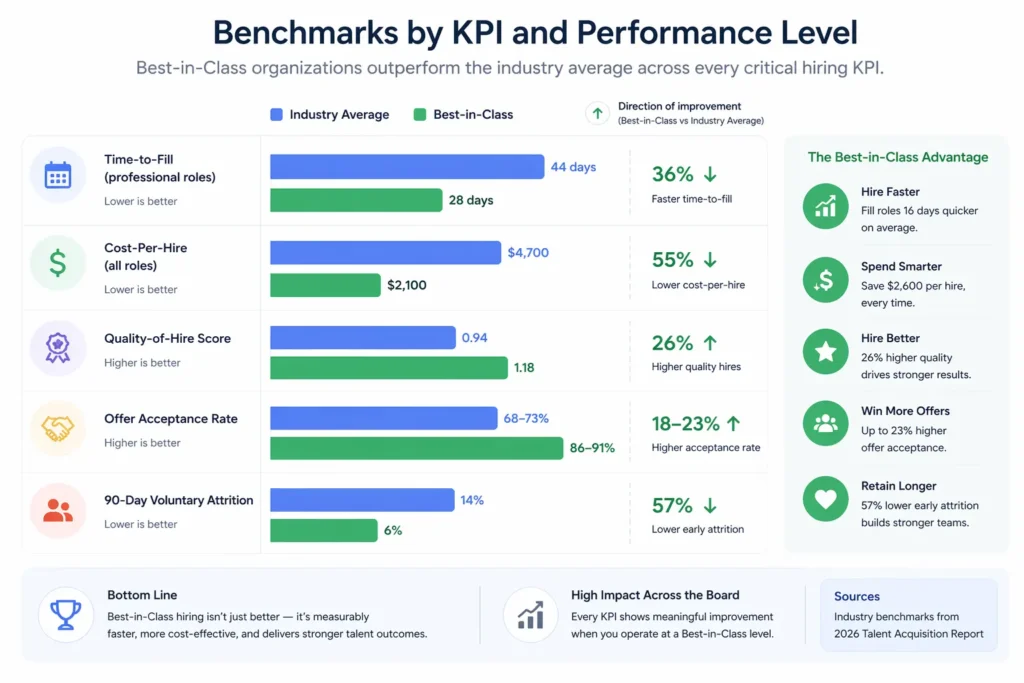
Benchmarks by KPI and Performance Level
| KPI | Industry Average | Best-in-Class |
|---|---|---|
| Time-to-Fill (professional roles) | 44 days | 28 days |
| Cost-Per-Hire (all roles) | $4,700 | $2,100 |
| Quality-of-Hire Score | 0.94 | 1.18 |
| Offer Acceptance Rate | 68–73% | 86–91% |
| 90-Day Voluntary Attrition | 14% | 6% |
Key Strategies for Building an Effective HR KPI Program
How Can AI and Automation Improve KPI Management?
Continuous KPI Monitoring
AI-powered analytics platforms can monitor KPI performance continuously, surfacing alerts when specific metrics diverge from target ranges or trend expectations, rather than relying on periodic human-compiled reports. Continuous monitoring converts KPI tracking from a reporting activity to a real-time decision support function.
Predictive KPI Modeling
Machine learning models can forecast future KPI performance based on current pipeline data, market trends, and historical patterns, providing TA leaders with projected time-to-fill, expected offer acceptance rates, and quality-of-hire predictions before the outcomes materialize. Predictive KPI modeling enables proactive intervention rather than reactive correction.
Automated Root Cause Analysis
AI analytics tools can identify the drivers of KPI performance changes, attributing a time-to-fill increase to specific role categories, sourcing channels, or approval process delays, with a level of analytical depth and speed that manual reporting cannot match. Automated root cause analysis converts the “what happened” insight into the “why it happened” insight that is required for decision-making.
Natural Language KPI Querying
Modern AI analytics platforms increasingly include conversational interfaces that allow HR leaders to query KPI data in natural language (“What was our offer acceptance rate for engineering roles last quarter, and how did it compare to the prior year?”) without requiring analyst preparation of each question. This democratizes KPI insight beyond the analytics team to the decision-makers who need it.
Stop Juggling
10 Job Boards.
Search One
Your next role is already here. avua pulls opportunities from across the web into a single searchable feed; filtered by role, location, salary, and remote preference.
1.5 Million+
Active Jobs
380+
Job Categories
KPIs and Diversity & Inclusion
DEI as a KPI Dimension, Not a Separate Report
The most effective DEI measurement programs integrate demographic representation data into core HR KPIs rather than maintaining it as a separate reporting stream. Quality-of-hire tracked by demographic group, time-to-fill by representation tier, offer acceptance rate by demographic category, and 90-day attrition by hiring cohort composition, these dimensions make DEI accountability part of the core performance conversation rather than a supplementary exercise.
Representation Pipeline KPIs
Leading DEI KPIs track representation through the hiring funnel, not just at hire and workforce level, but at application, screening, interview, shortlist, and offer stages. The gap between representation at application and representation at hire is the diagnostic metric for process equity; closing that gap requires stage-level representation tracking that most organizations do not yet have in place.
Pay Equity KPIs
Compensation equity, tracking the ratio of compensation by demographic group for equivalent roles, levels, and experience, is one of the most consequential and least frequently KPI-tracked dimensions of HR performance. Organizations that track and report pay equity as a core KPI with board-level visibility are consistently more equitable in their compensation outcomes than those for whom it is an annual compliance audit.
Common Challenges and Solutions
| Challenge | Solution |
|---|---|
| Too many metrics diluting analytical focus | Conduct a KPI audit: apply the “so what” test to every tracked metric; remove or downgrade to secondary status any metric that has not informed a documented decision in the past 12 months |
| KPIs tracked but not reviewed in decision-making | Restructure leadership review meetings around KPI performance and required decisions; eliminate purely descriptive reporting |
| Quality-of-hire difficult to measure consistently | Define the specific performance rating, retention milestone, and manager assessment criteria that constitute the QoH score before measuring; consistency of definition is more important than sophistication |
Real-World Case Studies
Case Study 1: The Technology Scale-Up
A 400-person technology scale-up with a 35-metric recruiting dashboard rationalized to seven core KPIs: time-to-fill by role tier, qualified application rate by channel, offer acceptance rate, quality-of-hire score, 90-day attrition, cost-per-hire, and recruiter utilization rate. Reporting preparation time fell from 32 hours per month to 9 hours. More significantly, the six monthly review meetings following the rationalization each produced at least one documented process change driven by KPI data, compared to an average of 0.8 process changes per quarter in the prior year.
Case Study 2: The Financial Services Firm
A financial services firm added stage-level demographic representation tracking to their recruiting KPI set, measuring the representation of underrepresented groups at application, screening, interview, shortlist, and offer stages. The data revealed that their sourcing was producing a demographically diverse application pool, but that representation dropped significantly at the interview-to-shortlist transition. Investigation found that unstructured hiring manager interviews were the primary attrition point. A structured interview implementation program, driven by the KPI finding, improved representation consistency at the shortlist stage from 0.62 to 0.91 within three hiring cycles.
Case Study 3: The Healthcare System
A healthcare system implemented AI-powered KPI monitoring that tracked clinical role time-to-fill in real time and generated alerts when specific role categories or locations were trending above target. The real-time alerts enabled the TA team to reallocate sourcing resources to high-time-to-fill locations before vacancies became critical, reducing the proportion of clinical roles exceeding 45-day time-to-fill from 34% to 11%.
Building a High-Signal HR KPI Dashboard: What to Track?
A best-practice recruiting and HR KPI program concentrates on eight to twelve high-signal indicators in four categories:
Each KPI should have a defined target (set at the start of the planning cycle), a measurement frequency (monthly for process KPIs; quarterly for outcome KPIs), a named owner (accountable for both the measurement and the response to deviations), and a documented decision history (what changes the KPI has driven).
KPIs Across the HR Lifecycle
Talent Planning: KPIs as Goal-Setting Inputs
At the annual talent planning stage, KPI targets for the coming year should be set based on business strategy inputs (what hiring volume is planned, what capability gaps need to be closed) and historical baseline data (what current KPI performance is). Targets that are set without reference to either business strategy or historical baseline are aspirational numbers without accountability grounding.
Recruiting Execution: Real-Time KPI Monitoring
During active recruiting periods, the most valuable KPI visibility is real-time, leading indicators that signal whether the process is on track before it produces below-target outcomes. Pipeline coverage ratio, candidate engagement rates, and time-in-stage metrics are the leading KPIs most useful during execution.
Quarterly Review: Trend Analysis and Adjustment
Quarterly KPI reviews should focus on trend analysis and process adjustment decisions, identifying whether KPIs are moving in the right direction and what specific changes would accelerate improvement. A quarterly review that produces no documented process changes has not served its purpose.
Annual Evaluation: Outcome Accountability and Target Reset
Annual KPI evaluation closes the accountability loop, assessing whether the year’s outcomes matched the plan, attributing performance gaps to specific root causes, and setting the foundation for next year’s targets. Quality-of-hire and attrition data, which require time to accumulate, is most meaningfully evaluated at the annual cycle.
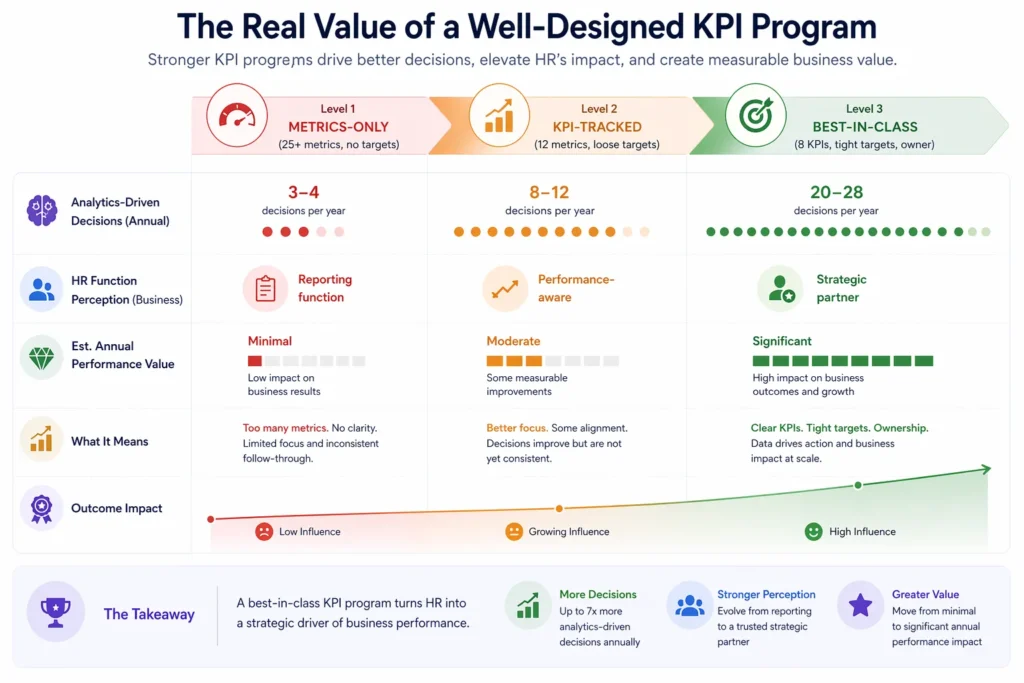
The Real Value of a Well-Designed KPI Program
| KPI Program Quality | Analytics-Driven Decisions (Annual) | HR Function Perception (Business) | Est. Annual Performance Value |
|---|---|---|---|
| Metrics-only (25+ metrics, no targets) | 3–4 | Reporting function | Minimal |
| KPI-tracked (12 metrics, loose targets) | 8–12 | Performance-aware | Moderate |
| Best-in-class (8 KPIs, tight targets, owner) | 20–28 | Strategic partner | Significant |
Related Terms
| Term | Definition |
|---|---|
| Metric | Any quantified measurement of an observable activity or outcome; broader category than KPI |
| OKR (Objectives and Key Results) | A goal-setting framework that pairs qualitative objectives with quantified key results; often used alongside or instead of KPIs |
| Benchmark | A reference value representing industry standard or best-in-class performance against which actual performance is compared |
| HR Analytics | The discipline of applying data analysis to workforce data to inform HR and business decisions |
| Dashboard | A visual display of multiple KPIs or metrics providing a consolidated performance overview |
Frequently Asked Questions
How many KPIs should a recruiting team track?
Research on analytics program effectiveness consistently suggests that 6–12 actively managed KPIs produce better decision quality than 20+ tracked metrics. The number matters less than the rigor of KPI selection, each indicator should be connected to a goal, owned by a named accountable party, and regularly reviewed for decision-making.
What is the difference between a KPI and a metric?
All KPIs are metrics, but not all metrics are KPIs. A metric is any quantified measurement. A KPI is a metric that has been selected specifically because it measures progress toward a defined strategic goal, has a target set against it, and is tracked for the purpose of informing decisions. The distinguishing characteristics are goal connection, target setting, and decision utility.
How do you set KPI targets that are realistic but challenging?
Effective target-setting combines three inputs: the historical baseline (what current performance level is), the business requirement (what performance level is needed to achieve the business goal), and the benchmark (what best-in-class organizations achieve). Targets that are set significantly above both the historical baseline and the business requirement without a clear path are aspirational; targets that are set at or below current performance are accountability theater.
Should HR KPIs be shared with the broader business?
Yes, for the KPIs that most directly reflect HR’s contribution to business outcomes. Quality-of-hire, time-to-fill for critical roles, and voluntary attrition rate are the KPIs most meaningful to business leaders. Sharing these demonstrates accountability and builds the credibility of HR as a strategic function. Internal process KPIs (recruiter utilization, req-to-post time) are typically internal management tools rather than business-facing accountability metrics.
How frequently should KPIs be reviewed?
Process KPIs (time-to-fill, qualified application rate, offer acceptance rate) benefit from monthly review because they reflect activity within the current period. Outcome KPIs (quality-of-hire, 90-day attrition, internal mobility rate) accumulate over time and are most meaningfully reviewed quarterly or annually, when enough outcome data has materialized to support trend analysis.
Conclusion
The difference between an HR function that is a strategic partner and one that is a reporting service is not the volume of data produced, it is the quality of the decisions that data informs.
A well-designed KPI program, small, targeted, goal-connected, and actively used to change behavior, is the operational mechanism of that difference. Organizations that have built genuine KPI discipline into their talent acquisition and HR practices consistently outperform those that have built comprehensive reporting without it.
Measure less.
Decide more.
That is the KPI imperative.