If candidates are reaching the finish line and still saying no, something is broken.
Offer acceptance rate is one of those metrics that hiring teams often overlook until it becomes a problem, and by then the damage, in wasted time, inflated cost per hire, and missed business targets, is already done.
Offer acceptance rate is the percentage of formal job offers that are accepted by candidates, and it is one of the clearest indicators of how well your recruitment process is actually landing. A low rate does not always mean your base salary is off. It can point to a broken candidate experience, a misaligned employer of record proposition, or simply a process that moves too slowly and loses candidates to faster-moving competitors.
For teams investing in data-driven recruiting, offer acceptance rate sits alongside time-to-fill and cost per hire as a core hiring health metric. This guide breaks down what drives it, how to benchmark it, and what to do when the numbers are telling you something is wrong.
The core metric governing offer management effectiveness is the Offer Acceptance Rate: the proportion of formal employment offers extended that result in accepted offers within the agreed response window.
Offer Acceptance Rate (%) = (Offers Accepted / Offers Extended) × 100
Top-performing organizations maintain Offer Acceptance Rates above 90%. Industry average sits closer to 83%. The gap between average and excellent is almost never explained by compensation alone. It is explained by process quality, candidate relationship investment, and the precision with which the offer reflects what the candidate was told to expect throughout the process.
What is Offer Acceptance Rate?
Offer acceptance rate is the percentage of formal job offers extended to candidates during a defined period that are accepted, serving as a primary measure of how effectively an organization converts its top candidate selections into confirmed hires, and as a diagnostic indicator of alignment between candidate expectations, compensation competitiveness, process experience, and employer brand strength throughout the hiring funnel.
What distinguishes offer acceptance rate from other recruitment metrics is its position at the terminal point of the hiring process. A low time-to-fill tells you the process is slow. A high cost-per-hire tells you sourcing is expensive. A low offer acceptance rate tells you something more damaging: the process succeeded in identifying and selecting a candidate, then lost them at the last step. All the investment made before the offer, every sourcing dollar, every interview hour, every recruiter relationship is written off the moment a candidate declines.
Why Offer Acceptance Rate Is the Defining Metric of Hiring Funnel Effectiveness?
The common instinct when offer acceptance rates decline is to look immediately at compensation. The salary is too low, the equity is uncompetitive, the bonus structure is behind market. And sometimes this is correct. But research on declined offers consistently shows that compensation is the primary reason in only approximately 35% of declines.
The remaining 65% of offer declines are driven by factors that were established, or failed to be established, earlier in the process: a competing offer that moved faster, a candidate experience that created doubt, a role description that turned out to be materially different from what the interview process communicated, or a hiring manager interaction that reduced the candidate’s confidence in the team they would be joining.
This matters because the interventions for a compensation-driven decline rate and a process-driven decline rate are entirely different. Organizations that diagnose every OAR problem as a compensation problem and respond by increasing offer values without addressing process quality consistently find that their OAR improves modestly and temporarily, then deteriorates again, because they are treating a symptom of a systemic issue rather than the issue itself.
Consider a concrete scenario: a professional services firm runs a twelve-week search for a senior analytics hire, conducts four interview rounds, and presents an offer at week eleven. The candidate declines, citing a compe ting offer that was presented and closed in six weeks. The firm’s compensation was competitive; their process was not. The search had to restart entirely, burning an additional eight weeks and approximately $14,000 in incremental sourcing and recruiter time. The OAR for that search was zero. The cause was not pay, it was pace.
The data on process-related OAR drivers is well-documented. According to LinkedIn’s Global Talent Trends research, 57% of candidates who decline an offer report that the length of the hiring process was a contributing factor. Among candidates who declined in favor of a competing employer, 71% report that the competing employer moved at least two weeks faster at the offer stage. These are not compensation problems. They are process design problems, and they are fully within a recruiting team’s control to address.
The ROI math on OAR improvement is direct and significant. For an organization making 60 hires per year at an average cost-per-hire of $6,500, an OAR of 82% means that approximately 11 offers per year are declined. Each declined offer requires a re-sourcing cycle that costs, conservatively, 60-70% of the original cost-to-hire, plus the extended vacancy cost for the additional weeks the role remains open.
Across 11 declined offers at an average re-sourcing cost of $4,500 and a vacancy cost of $280 per day for an average of 22 additional open days, the total annual cost of a below-benchmark OAR is approximately $118,000. Improving OAR from 82% to 91% reduces declined offers from 11 to approximately 5, saving roughly $66,000 annually through a combination of avoided re-sourcing costs and reduced vacancy duration. That saving funds substantial investment in offer process improvement, compensation benchmarking infrastructure, and candidate experience initiatives.
For TA leaders, the practical conclusion is clear: offer acceptance rate should be tracked at the recruiter level, the hiring manager level, the department level, and the role-type level, because each segmentation reveals a different diagnostic story. A single organizational OAR number is useful for benchmarking. A segmented OAR analysis is what tells you where to intervene and how.
Your Resume Isn’t Getting Read
Let’s Get That Fixed!
75% of resumes get auto-rejected. avua’s AI Resume Builder optimizes formatting, keywords, and scoring in under 3 minutes, so you land in the “yes” pile.
The Psychology Behind Offer Acceptance Rate
Expectation Calibration and the Surprise Effect
The single most reliable predictor of offer acceptance is whether the offer aligns with what the candidate was led to expect during the interview process. When the offer matches or exceeds expectations built during the process, acceptance rates are very high, typically above 93% in well-managed searches. When the offer diverges materially from what was discussed or implied, whether through a lower-than-expected salary, a less senior title, or materially different terms, candidates experience the discrepancy as a breach of trust rather than a negotiation starting point.
The expectation gap, not the absolute offer value, is what drives a disproportionate share of declines. Recruiters who conduct explicit pre-offer conversations that confirm compensation expectations before the formal offer is made consistently report acceptance rates 12-15 percentage points above those who present offers without prior calibration.
Loss Aversion and the Counter-Offer Dynamic
Candidates evaluating a job offer are not operating in a rational utility-maximizing framework. They are operating under loss aversion: the psychological reality that the prospect of losing something already held, their current salary, their existing team, their established status, feels significantly more painful than the equivalent gain from a new opportunity.
This loss aversion dynamic is what makes counter-offers so effective at reversing acceptance decisions and what makes the timing of offers so critical. A candidate who has mentally committed to a move before receiving a counter-offer from their current employer is far more likely to maintain their acceptance than one who receives a counter-offer before they have fully committed psychologically. Recruiters who accelerate the signing timeline and facilitate early start-date commitment reduce counter-offer vulnerability significantly.
Competing Offer Framing and Anchoring Effects
When a candidate holds multiple offers, the order in which those offers arrived and the anchoring effect of the first offer seen materially influences how subsequent offers are evaluated. Candidates who receive a higher offer first anchor their expectations at that level and evaluate all subsequent offers relative to it, even when the total package including equity, benefits, flexibility, and growth potential would favor a different choice.
This anchoring dynamic means that speed-to-offer is not just a process efficiency metric; it is a competitive strategy. The organization that gets a quality offer in front of a candidate first sets the evaluative anchor that all other organizations have to beat.
Offer Acceptance Rate vs. Related Hiring Metrics
| Metric | What It Measures | Diagnostic Lens | Key Limitation |
|---|---|---|---|
| Offer Acceptance Rate | Proportion of offers accepted | Final-stage conversion effectiveness | Doesn’t reveal why offers are declined without exit data |
| Offer Decline Rate | Proportion of offers declined | Problem identification | Requires root cause analysis to be actionable |
| Interview-to-Offer Rate | Candidates interviewed who receive offers | Evaluation precision | Measures selection quality, not offer quality |
| Time-to-Offer | Days from final interview to offer presentation | Process efficiency | Does not capture candidate perception of timeline |
| Offer Renegotiation Rate | Offers modified before acceptance | Compensation calibration quality | Can indicate poor pre-offer expectation setting |
| Quality of Hire | 12-month performance of placed candidates | Long-term hire value | Lagging indicator, not useful for real-time OAR management |
The critical distinction between offer acceptance rate and offer decline rate is diagnostic purpose. Offer acceptance rate tells you the scale of the problem. Offer decline rate, with structured root cause coding applied, tells you the nature of the problem. Both are necessary; neither alone is sufficient for building an effective intervention strategy.
What the Experts Say?
Offer acceptance rate is the most honest report card a recruiting function receives. Every other metric can be rationalized or contextualized. When a candidate says no to your offer, they’re telling you something precise about the gap between what you promised and what you delivered. The organizations that treat every decline as a learning event rather than an isolated setback are the ones that sustainably close at 90-plus percent.
– Liz Ryan, Founder and CEO, Human Workplace; Forbes Contributor on Modern Work
How to Measure Offer Acceptance Rate?
Formula
Offer Acceptance Rate (%) = (Offers Accepted / Offers Extended) × 100
Competitive Offer Loss Rate (%) = (Offers Declined Due to Competing Offer / Total Declined Offers) × 100
Compensation-Driven Decline Rate (%) = (Offers Declined on Compensation Grounds / Total Declined Offers) × 100
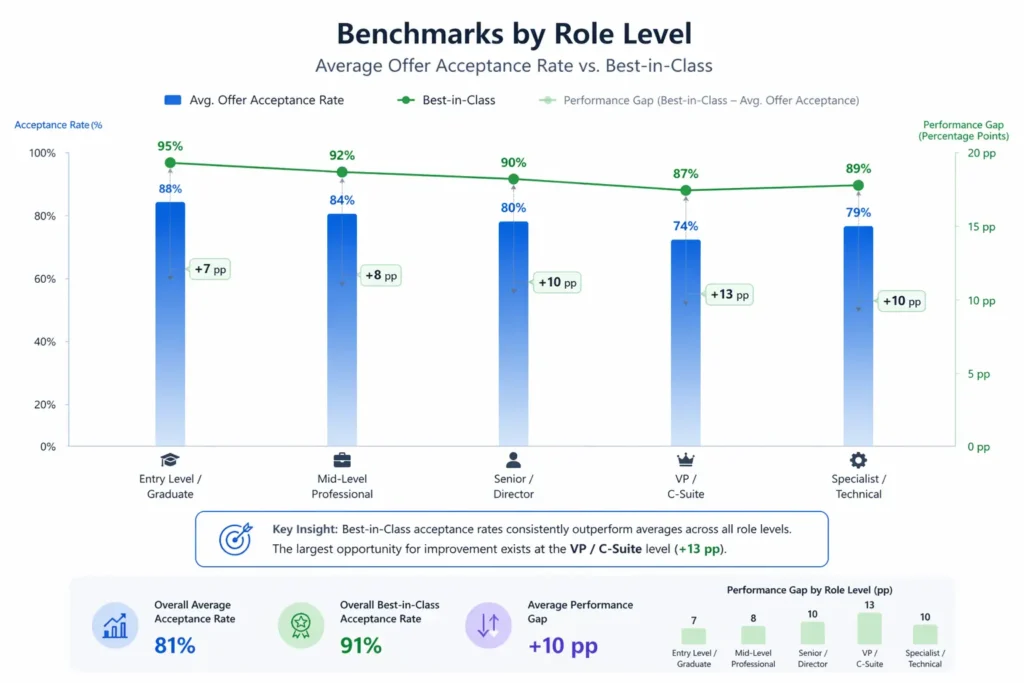
Benchmarks by Role Level
| Role Level | Avg. Offer Acceptance Rate | Best-in-Class |
|---|---|---|
| Entry Level / Graduate | 88% | 95% |
| Mid-Level Professional | 84% | 92% |
| Senior / Director | 80% | 90% |
| VP / C-Suite | 74% | 87% |
| Specialist / Technical | 79% | 89% |
Key Strategies for Improving Offer Acceptance Rate
How Can AI and Automation Support Offer Acceptance Rate?
Real-Time Compensation Intelligence
AI-powered compensation benchmarking tools can pull real-time salary, equity, and benefits data from market databases, offer benchmarks across similar companies, and accepted-versus-declined offer histories to recommend offer parameters before the formal offer is constructed. This predictive compensation intelligence shifts offer design from backward-looking benchmarks to forward-looking market positioning, materially reducing the proportion of declines attributable to compensation misalignment. The ability to see what comparable candidates accepted at comparable companies in the past 90 days is qualitatively different from using annual salary surveys.
Candidate Sentiment Analysis During the Process
Natural language processing tools applied to candidate communication patterns, response times, engagement signals, and interview feedback language can generate candidate sentiment scores that predict the likelihood of offer acceptance before the offer is extended. A candidate whose engagement signals have been declining across interview stages, whose responses have slowed, and whose interview language has become less enthusiastic is signaling reduced interest in ways that may not be explicitly communicated. Recruiter awareness of these signals before the offer stage creates the opportunity for a re-engagement conversation rather than a surprise decline.
Automated Offer Delivery and Tracking
AI-powered offer management platforms can deliver formal offer packages digitally, track candidate engagement with the offer document, identify when the candidate has reviewed and not responded, and trigger timed follow-up communications that maintain momentum without applying uncomfortable pressure. The visibility into offer document behavior, specifically whether a candidate has opened, reviewed, and re-reviewed specific sections, provides actionable intelligence about where uncertainty or hesitation is concentrated.
Competitive Offer Intelligence
Machine learning models trained on hiring activity data can identify when a candidate is likely to be holding multiple active processes, based on their response cadence, interview availability patterns, and engagement signals. This intelligence allows recruiters to accelerate their own process specifically for candidates at elevated competing-offer risk, rather than applying a uniform timeline to all candidates regardless of their individual competitive situation.
Stop Juggling
10 Job Boards.
Search One
Your next role is already here. avua pulls opportunities from across the web into a single searchable feed; filtered by role, location, salary, and remote preference.
1.5 Million+
Active Jobs
380+
Job Categories
Offer Acceptance Rate and Candidate Experience Equity
Demographic Patterns in Offer Decline Rates
Offer acceptance rate analysis by candidate demographic reveals consistent and important disparities that are rarely surfaced in aggregate OAR reporting. Research on hiring outcomes published by SHRM consistently shows that candidates from underrepresented groups decline offers at higher rates than the candidate population average, not because compensation offers are structurally lower in all cases, but because the broader candidate experience and the cultural signals embedded in the interview process create a higher threshold of confidence required before those candidates commit to a move.
An organization whose aggregate OAR is 85% may have an OAR for underrepresented candidates that is 10-12 points lower, a gap that is invisible in aggregate reporting and that represents a meaningful equity problem in the hiring funnel.
The Role of Process Transparency in Equitable Outcomes
Candidates with less institutional familiarity with professional hiring norms, including first-generation professionals and candidates from non-traditional career backgrounds, are more dependent on clear, proactive communication from the recruiting team to navigate the offer stage with confidence. Ambiguity about timeline, process, and decision factors that a candidate with greater institutional familiarity can tolerate or interpret charitably will cause higher attrition among candidates who lack that interpretive frame.
The candidate journey design decisions that improve transparency throughout the process directly improve offer acceptance equity. Structured offer stage communication, explicit timelines, and proactive answers to anticipated questions are equity interventions as much as they are process quality improvements.
Benefit Package Framing and Intersecting Needs
The components of a total compensation package that matter most vary significantly by candidate circumstance, and the standard order in which offer packages present compensation elements reflects assumptions about candidate priorities that do not hold uniformly. Candidates with caregiving responsibilities may weight flexibility and leave provisions more heavily than equity grants. Candidates with student debt may weight base salary over long-term incentive structures.
Organizations that present offers in a single standard format and treat the package as a take-or-leave proposition consistently lose candidates whose priorities would have been well-served by the package, but who were unable to evaluate it clearly in the framing provided. Offer stage conversations that explicitly invite candidates to identify which elements of the package matter most to them enable more targeted and effective offer management for all candidates.
Common Challenges and Solutions
| Challenge | Solution |
|---|---|
| Candidates declining due to competing offers already in hand | Implement a competing offer check-in at the final interview stage; compress offer turnaround to 48-72 hours from final decision |
| Pre-offer compensation conversations revealing significant market misalignment | Conduct compensation benchmarking before the search brief is finalized, not at the offer stage; update benchmarks quarterly for hard-to-fill role families |
| Hiring manager unavailable or disengaged during the offer and closing stage | Establish explicit hiring manager commitments to the offer stage in the initial intake meeting; brief hiring managers on their role in closing before any offer is extended |
| Candidates accepting then reneging before start date | Implement a structured post-acceptance engagement protocol; connect new hires to their future team before day one to build social investment in joining |
Real-World Case Studies
Case Study 1: The Technology Product Company
A 300-person technology company with an OAR of 76% conducted a structured decline analysis across 34 offers declined over two quarters. The root cause breakdown revealed that 41% of declines cited a competing offer accepted during the company’s offer approval process, which averaged 11 days from final interview to written offer.
The TA team restructured the offer approval workflow to require hiring manager and finance sign-off within 24 hours of final interview completion, reducing average offer turnaround to 3.4 days. In the following two quarters, OAR improved to 88%. No changes were made to compensation structure. The cost savings from avoided re-sourcing cycles over the two quarters were estimated at $74,000 against a process redesign investment of approximately $8,000 in recruiter and HRIS time.
Case Study 2: The Regional Healthcare Network
A regional healthcare network found that its OAR for nursing and clinical specialist roles was consistently 14 points below its OAR for administrative and operational roles (69% versus 83%). Decline debrief analysis revealed that clinical candidates in the final stages of the process were frequently receiving counter-offers from their current employers within 48 hours of giving notice, because the network’s offer process required candidates to resign before their start date was confirmed.
The TA team redesigned the offer process to include a confirmed start date commitment from the hiring unit before the offer was extended, allowing candidates to resign with greater certainty. Clinical OAR improved to 79% within one hiring cycle, and counter-offer vulnerability dropped measurably.
Case Study 3: The Professional Services Firm
A national professional services firm implemented a structured pre-offer alignment conversation protocol across all senior-level searches after its C-suite OAR fell to 71%. The protocol required the lead recruiter to conduct an explicit offer-preview conversation with the finalist candidate 48 hours before the formal offer, confirming compensation expectations, addressing outstanding questions about the role, and identifying any remaining decision factors the candidate needed addressed before committing.
Within three hiring cycles, C-suite OAR improved from 71% to 86%. The pre-offer conversations also surfaced two searches where the finalist’s compensation expectations were materially above the approved range, allowing those searches to reset at the finalist stage rather than after a formal offer decline.
Building an Offer Acceptance Rate Monitoring System: Key Metrics to Watch
Offer Acceptance Rate Across the Hiring Lifecycle
Awareness and Sourcing Stage
OAR is shaped earlier in the hiring process than most organizations realize. Candidates who enter the pipeline with a clear, accurate understanding of the role, the team, and the compensation philosophy are substantially more likely to accept an offer at the end of the process than those whose understanding has been shaped by a vague job description, an imprecise intake conversation, or employer brand messaging that does not match the interview experience. The candidate engagement quality established at the sourcing stage establishes the expectation framework that either validates or contradicts the eventual offer. An organization with a strong, accurate employer brand and precise role positioning starts every search with a structural OAR advantage.
Interview and Evaluation Stage
The interview process is the primary OAR intervention point because it is where candidates form the convictions they carry to the offer decision. Every interaction with an interviewer is evaluated not just as a competency assessment but as a signal about what it would be like to work in this organization. A disorganized interview process, a hiring manager who appears disengaged, or an evaluation experience that feels perfunctory sends signals that reduce offer acceptance probability regardless of what the offer itself contains. TA leaders who treat the candidate experience during interviews as a closing tool, not just an evaluation mechanism, consistently report higher OAR on competitive roles.
Offer Construction and Presentation Stage
The formal offer stage is where the investment made throughout the process is either monetized or forfeited. Offer packages that accurately reflect what was communicated during the process, that are presented with genuine enthusiasm by both recruiter and hiring manager, and that arrive within a competitive timeframe relative to the candidate’s other active processes have structurally higher acceptance probability. Every element of offer construction and presentation is a lever: the total package design, the delivery format, the timing, the verbal context provided by the recruiter, and the follow-up contact from the hiring manager all contribute to whether the candidate says yes.
Post-Acceptance Integration
OAR management does not end at the signed offer letter. The pre-boarding period between offer acceptance and day one is the window of highest renegotiation and reversal risk, and organizations that invest in structured pre-boarding engagement significantly reduce the incidence of last-minute declines. Connecting accepted candidates to their future team members, providing clear logistics and schedule information for day one, and maintaining regular recruiter contact during notice periods are low-cost interventions that materially reduce acceptance reversal rates. This pre-boarding investment also directly supports the onboarding quality that determines 90-day retention outcomes.
The Real Cost of a Low Offer Acceptance Rate
| Scenario | OAR | Avg. Declined Offers (60 hires/year) | Estimated Annual Re-sourcing Cost |
|---|---|---|---|
| Below average (unmanaged) | 76% | 14 | $142,000 |
| Industry average | 83% | 10 | $98,000 |
| Best-in-class (managed process) | 92% | 5 | $47,000 |
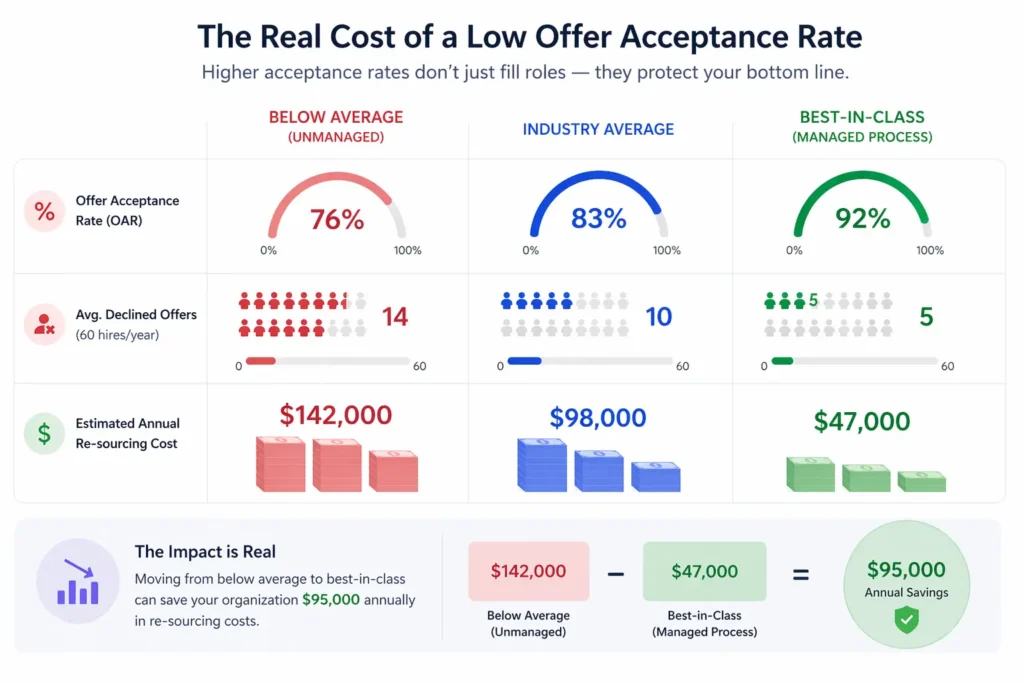
Re-sourcing cost estimated at $4,800 per declined offer, including recruiter time, sourcing tools, and extended vacancy cost of $280 per day for an average 18 additional open days per re-initiated search.
Related Terms
| Term | Definition |
|---|---|
| Candidate Experience | The sum of a candidate’s perceptions and interactions with an organization throughout the hiring process |
| Offer Decline Rate | The proportion of formal offers extended that are rejected by candidates |
| Time-to-Offer | The elapsed days from final interview completion to formal offer presentation |
| Pre-Offer Alignment | A structured conversation between recruiter and candidate confirming compensation and terms expectations before the formal offer is presented |
| Counter-Offer | A competing offer made by a candidate’s current employer in response to their resignation or disclosure of an external offer |
| Total Compensation | The full value of an employment offer including base salary, variable pay, equity, benefits, and non-monetary elements |
Frequently Asked Questions
What is a good offer acceptance rate?
Industry benchmarks vary by role level and sector, but a healthy organizational OAR falls between 85-90% for most professional hiring contexts. Best-in-class recruiting functions consistently achieve rates above 90% through a combination of pre-offer calibration, competitive compensation benchmarking, and compressed offer timelines. Rates below 80% warrant structured diagnostic investigation at the role-type and hiring manager level.
Why do candidates decline job offers?
Offer declines have multiple root causes. Compensation misalignment accounts for approximately 35% of declines. Competing offers that arrived earlier or moved faster account for roughly 30%. Process experience concerns, including disorganized interviews, poor communication, or hiring manager disengagement, account for approximately 20%. The remaining 15% involve personal circumstances, timing issues, or role-fit concerns identified during the process. Effective OAR management requires tracking each category separately, because each requires a different intervention.
How does process speed affect offer acceptance rate?
Process speed is one of the most significant and directly controllable OAR drivers. Organizations that reduce their time-to-offer below four days from final interview decision consistently report OAR improvements of 8-12 percentage points on competitive roles. Slower processes allow competing offers to close, counter-offers to be initiated, and candidate enthusiasm to decay. The relationship between offer timeline and acceptance rate is particularly pronounced at the senior and specialist level, where candidates are most likely to hold multiple active processes simultaneously.
Should compensation always be discussed before the formal offer?
Yes, for every role above entry level. A pre-offer alignment conversation that confirms compensation expectations before the formal offer is drafted converts the offer from a high-stakes surprise into a confirmation of a mutually understood agreement. This conversation also surfaces misalignment while there is still time to address it, rather than after a formal decline. Recruiters who conduct systematic pre-offer calibration report substantially fewer unexpected declines on compensation grounds.
How can a hiring manager improve offer acceptance rate?
The hiring manager’s most impactful contribution to OAR is a personal, timely, and genuinely enthusiastic communication to the candidate at or immediately after the offer stage. This contact should be specific about why that candidate was chosen and what the manager is looking forward to about the working relationship. Candidates deciding between comparable offers disproportionately base their final choice on their confidence in their future manager, and a credible expression of genuine interest from the hiring manager is among the most effective closing tools available. For more on the hiring manager’s role in recruitment outcomes, see Hiring Manager.
Does employer brand affect offer acceptance rate?
Directly and significantly. Candidates who enter the hiring process with a positive prior perception of the employer and whose interview experience confirms or exceeds that perception accept offers at materially higher rates than those whose experience creates doubt. Employer brand operates as a pre-commitment mechanism: candidates who feel proud of the organization they are about to join are less susceptible to competing offers and counter-offer dynamics at the offer stage. This is why employer brand investment should be evaluated partly through its OAR impact, not only through its sourcing funnel effects.
What should be included in an offer decline debrief?
An effective decline debrief captures the primary reason for declining, the alternative opportunity chosen if any, whether any element of the recruiting process contributed to the decision, and whether the candidate would consider the organization for a future opportunity. This data should be coded against a standard taxonomy and reviewed in aggregate monthly. According to research from Harvard Business Review on hiring effectiveness, organizations that systematically analyze candidate feedback at the offer stage improve their overall hiring funnel conversion within two to three recruitment cycles.
Conclusion
Offer acceptance rate is not the final box to check in a completed hiring process. It is the scorecard for everything that came before it: the precision of the job description, the quality of the sourcing, the caliber of the candidate experience, the rigour of compensation benchmarking, and the effectiveness of the hiring manager at every stage of evaluation. Organizations that treat OAR as a lagging number to observe are consistently surprised by declines they could have anticipated and prevented.
Those that manage it as a leading indicator, segmented by role type, hiring manager, and decline root cause, and connected to specific process interventions at each stage, convert their best candidate selections into confirmed hires at rates that compound into a genuine talent acquisition advantage. A one-point improvement in OAR is not a rounding error.
At scale, it is tens of thousands of dollars in avoided re-sourcing costs, weeks of recovered vacancy time, and a materially stronger hiring class. Manage the offer stage as deliberately as you manage the search that precedes it, and the numbers will follow. For a broader view of how offer acceptance fits into your overall hiring plan, ensure OAR targets are built into your quarterly planning cycle from the outset.