Offer too little and the best candidates walk.
Offer too much without a framework to justify it and you create internal pay inequity that quietly poisons team morale.
Salary benchmarking is how organisations find the defensible middle ground, and in a market where compensation transparency is increasing and candidates arrive at offer conversations better informed than ever, getting it right has never mattered more.
Salary benchmarking is the process of comparing an organisation’s compensation structures against external market data to ensure roles are priced competitively, fairly, and sustainably. It sits at the intersection of pay equity and talent strategy, informing everything from hiring plan budgets to offer acceptance rate outcomes and long-term employee retention.
For HR and people analytics teams, salary benchmarking is not a one-time exercise. It is an ongoing process that needs to be revisited as markets shift, roles evolve, and the competition for specialist talent intensifies. Static compensation structures in a dynamic market are not neutral, they are a slow leak in your retention strategy.
The core metric governing salary benchmarking effectiveness is the Compensation Competitiveness Ratio (CCR): the relationship between the organization’s median pay for a defined role and the market median for an equivalent position at comparable organizations.
Compensation Competitiveness Ratio (CCR) = (Organization Median Salary / Market Median Salary) x 100
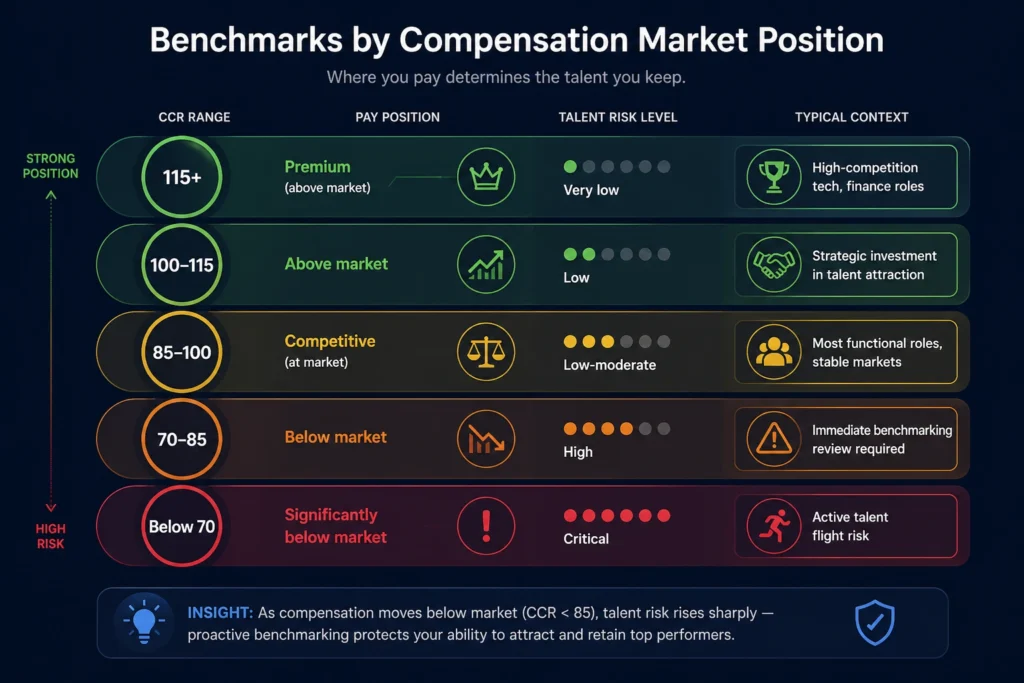
A CCR above 100 indicates an above-market position. A CCR between 85 and 100 reflects a broadly competitive stance. A CCR consistently below 85 for critical or high-demand roles is a quantifiable attrition and offer-rejection risk that shows up in recruiting metrics before it shows up in finance reports.
What is Salary Benchmarking?
Salary benchmarking is the structured, systematic process of collecting and analyzing external compensation data from credible market sources to evaluate whether an organization’s pay levels for specific roles, job families, or seniority bands are competitive within its relevant talent market. That market is typically defined by a combination of industry sector, geographic location, company size by revenue or headcount, and role function.
What distinguishes salary benchmarking from informal salary research is its rigor and consistent application across the organization’s full compensation architecture. Benchmarking requires matching internal roles to market-equivalent job definitions in survey data, applying a consistent methodology, and updating the analysis frequently enough to reflect current market conditions. Used correctly, it is the foundation of pay equity analysis, hiring plan budget validation, and offer strategy – not just an annual compliance exercise.
Why Salary Benchmarking Is an Essential Competitive Advantage in 2026?
The business case for salary benchmarking is concrete, and the organizations that have built it into their talent acquisition infrastructure consistently outperform those treating compensation as a budget constraint rather than a competitive variable.
Start with the candidate pipeline impact. According to data from LinkedIn Talent Solutions, 50% of candidates cite compensation as the primary driver of offer rejection. For organizations that have not updated their compensation benchmarks in the past twelve months, the probability that at least one-third of active roles are priced below market is high – particularly in technology, data science, digital marketing, and product management, where market rates have moved materially year over year.
An organization extending 40 offers per year and experiencing a 30% rejection rate for compensation reasons – 12 rejections annually – incurs approximately $4,500 in re-sourcing cost per rejection in recruiter time, advertising, and candidate management. That is $54,000 in annual cost attributable to a benchmarking gap that a $15,000 compensation survey subscription would have prevented.
The retention math compounds the case. Research published by the Society for Human Resource Management (SHRM) found that compensation dissatisfaction is the second-leading cited reason for voluntary turnover, following lack of career growth. For a 500-person organization operating at a 14% voluntary turnover rate, a 3-percentage-point reduction in turnover – achievable through systematic compensation realignment based on benchmarking data – prevents approximately 15 departures annually. At an average replacement cost of 50% of annual salary for mid-level professionals, each prevented departure is worth approximately $30,000. The 15-departure reduction represents $450,000 in avoided replacement cost per year, against a salary benchmarking investment that rarely exceeds $25,000 annually for a company of that size.
The more difficult calculation to make – but the one most worth making – is the opportunity cost of under-attracting talent. An organization that consistently prices senior roles at the 25th percentile of market, due to an outdated compensation philosophy not grounded in current benchmarking data, does not simply lose some candidates. It systematically attracts candidates who either have fewer external options than the market average or who have not done the salary research that well-prepared senior candidates routinely conduct.
The quality distribution of the resulting hire pool is skewed toward the lower end of the available talent market, and the effect compounds over multiple hiring cycles. The cost of this persistent under-attraction rarely appears on the P&L that justified the below-market pay position in the first place.
A concrete data point: research from WorldatWork, the leading total rewards association, found that organizations with formal salary benchmarking programs and documented pay positioning strategies experience voluntary turnover rates 18-22% lower than those without. The gap is explained not by organizational scale or industry but by the discipline of the benchmarking practice and the consistency with which its outputs are applied in hiring and retention decisions.
For TA leaders, the practical implication is direct. Salary benchmarking is not a compensation function that happens to affect recruiting. It is a talent acquisition strategy that happens to be executed through compensation data. Organizations that understand this distinction – and build benchmarking into their recruiting cycle rather than their annual review cycle – consistently report higher offer acceptance rates, lower time-to-fill for competitive roles, and measurably stronger candidate pipeline quality. Treat compensation competitiveness as a pipeline metric, not a budget constraint, and the ROI of continuous salary benchmarking becomes structural rather than incidental.
Your Resume Isn’t Getting Read
Let’s Get That Fixed!
75% of resumes get auto-rejected. avua’s AI Resume Builder optimizes formatting, keywords, and scoring in under 3 minutes, so you land in the “yes” pile.
The Psychology Behind Salary Benchmarking
Anchoring and Salary Expectation Formation
Anchoring bias is among the most well-documented cognitive effects in compensation negotiation. The first salary figure introduced in a compensation conversation disproportionately shapes the counterpart’s evaluation of what is reasonable. Candidates who have researched market rates before an offer conversation carry an internal anchor derived from that research.
When an organization opens with a figure significantly below that anchor, the candidate’s psychological experience is not neutrality but active disappointment – even if the total compensation package, including benefits and equity, is competitive. Salary benchmarking ensures the organization’s offer opening is calibrated against the candidate’s likely anchor, preventing the perception gap that drives offer rejections among candidates who otherwise intended to accept.
Fairness Perception and Internal Pay Equity
Equity theory in organizational psychology explains how employees evaluate their compensation not only in absolute terms but relative to perceived equivalents – colleagues in similar roles, peers at competitor organizations, and their own compensation history. When employees perceive their pay as below market or unfair relative to internal peers, the response follows a predictable sequence: disengagement, reduced discretionary effort, and eventually voluntary departure among employees who have external options.
Organizations that use salary benchmarking to maintain defensible, market-referenced pay structures reduce this fairness risk across the workforce – not just at hiring but throughout the employment lifecycle, making benchmarking outcomes a retention tool as much as a recruiting tool.
Market Signal and Employer Brand Coherence
Compensation levels communicate organizational values in ways that public statements cannot override. A company that publicly positions itself as a technology leader but pays engineering talent at the 30th percentile of market creates a signal dissonance that sophisticated candidates detect and interpret as a credibility signal about the organization’s broader commitments. Salary benchmarking maintains alignment between the organization’s talent market positioning and its actual compensation behavior – and that alignment is one of the underrecognized contributors to employer brand authenticity, which directly affects both candidate attraction and long-term employee retention.
Salary Benchmarking vs. Related Compensation Concepts
| Concept | Focus | Primary Input | Primary Output | Frequency |
|---|---|---|---|---|
| Salary Benchmarking | Pay vs. external market | Survey data, market intelligence | Competitive positioning assessment | Quarterly / Annual |
| Pay Equity Analysis | Pay vs. internal demographic peers | Internal HRIS data | Equity gap identification | Annual |
| Job Evaluation | Relative role value within organization | Internal role analysis | Grade and band structure | Periodic |
| Compensation Banding | Pay range per grade level | Benchmarking data plus job evaluation | Salary ranges for offers and reviews | Annual |
| Total Rewards Analysis | Full compensation and benefits vs. market | Survey plus benefits data | Total package competitiveness | Annual |
The critical distinction in the table above is that salary benchmarking is the primary input to most other compensation processes. Pay equity analysis, compensation banding, and total rewards design all depend on accurate external market data to function correctly. An organization that skips the benchmarking step is not just missing market intelligence – it is undermining the quality of every compensation decision that builds on it.
What the Experts Say?
Salary benchmarking is not about paying the median across the board. It is about making an informed, deliberate decision about where you want to sit in the market for each talent segment – and then actually sitting there, consistently, rather than discovering your position accidentally through offer rejections and exit interviews.
– Ann Bares, Principal, Altura Consulting Group; Editor, Compensation Cafe
How to Measure Salary Benchmarking Effectiveness?
Formulas:
Compensation Competitiveness Ratio (CCR) = (Organization Median Salary / Market Median Salary) x 100
Offer Rejection Rate - Compensation (%) = (Offers Rejected Citing Pay / Total Offers Extended) x 100
Compensation-Driven Attrition Rate (%) = (Exits Citing Pay Dissatisfaction / Total Voluntary Exits) x 100
Benchmarks by Compensation Market Position:
| CCR Range | Pay Position | Talent Risk Level | Typical Context |
|---|---|---|---|
| 115+ | Premium (above market) | Very low | High-competition tech, finance roles |
| 100-115 | Above market | Low | Strategic investment in talent attraction |
| 85-100 | Competitive (at market) | Low-moderate | Most functional roles, stable markets |
| 70-85 | Below market | High | Immediate benchmarking review required |
| Below 70 | Significantly below market | Critical | Active talent flight risk |
Key Strategies for Effective Salary Benchmarking
How Can AI and Automation Support Salary Benchmarking?
Real-Time Market Compensation Intelligence
AI-powered compensation platforms aggregate and normalize salary data from multiple sources continuously – job postings, offer acceptance data, third-party surveys, and labor market statistics – providing benchmarks that are updated in near-real-time rather than annually. This continuous update cycle is particularly valuable for high-velocity roles where market rates shift materially within a single hiring quarter. Platforms like Avua surface this real-time intelligence at the point of requisition, giving recruiters and hiring managers current benchmark data before candidate conversations begin rather than discovering misalignment at the offer stage.
Automated Role Matching and Survey Calibration
One of the most time-intensive aspects of traditional salary benchmarking is manually matching internal roles to equivalent survey job definitions. Natural language processing (NLP) tools can automate this matching by analyzing job description content against survey benchmark databases, identifying the closest market equivalents and flagging mismatches for human review. This automation reduces the analyst time required for a comprehensive benchmarking exercise from days to hours, enabling more frequent reviews without proportional increases in HR analyst capacity.
Predictive Compensation Modeling
Machine learning models trained on compensation data, candidate acceptance patterns, and attrition signals can predict where compensation gaps are most likely to produce talent pipeline losses before those losses occur. This predictive layer converts salary benchmarking from a backward-looking audit into a forward-looking talent risk management tool – surfacing roles approaching the compensation threshold where offer rejection rates rise or attrition risk increases, with enough lead time to make corrections proactively.
Compensation Equity Monitoring
AI tools can continuously monitor the organization’s pay distribution against market benchmarks by role, level, department, and demographic segment – surfacing equity gaps as they emerge rather than as annual surprises. This continuous monitoring, integrated with HR analytics platforms, supports both pay equity compliance and proactive retention management, converting compensation benchmarking from a periodic snapshot into a live strategic dashboard.
Stop Juggling
10 Job Boards.
Search One
Your next role is already here. avua pulls opportunities from across the web into a single searchable feed; filtered by role, location, salary, and remote preference.
1.5 Million+
Active Jobs
380+
Job Categories
Salary Benchmarking and Workforce Equity
Gender and Demographic Pay Gap Analysis
Salary benchmarking and pay equity analysis are related but distinct practices. Benchmarking measures where the organization’s pay sits relative to the external market. Pay equity analysis measures whether employees in equivalent roles are paid equitably relative to each other, with demographic groups as the primary lens. Both analyses are necessary: an organization can have competitive external benchmarks and significant internal demographic pay gaps simultaneously. The benchmarking data provides the market reference point that makes the equity analysis meaningful – without knowing where market is, it is impossible to determine whether internal pay differentials reflect legitimate market factors or systemic equity gaps requiring correction.
Transparent Compensation Bands and Negotiation Equity
One of the structural contributors to pay inequity is information asymmetry in compensation negotiation: employees who negotiate more aggressively – a behavior that research consistently shows differs by gender and cultural background – receive higher starting salaries than equally qualified employees who accept initial offers. Salary benchmarking-backed compensation bands, published transparently as part of job postings and internal role descriptions, reduce this negotiation gap by narrowing the range within which compensation decisions are made. Several U.S. states including California, Colorado, and New York now require pay range disclosure in job postings – making transparent, benchmarked compensation bands a legal compliance requirement in addition to an equity best practice.
Sourcing Channel Equity and Benchmark Representation
Compensation benchmarks built primarily from data about candidates sourced through traditional recruiting channels may systematically undervalue talent from non-traditional or underrepresented backgrounds. AI-powered salary benchmarking tools that incorporate compensation data from broader candidate pools help correct this sourcing bias, ensuring that benchmarks reflect the full talent market rather than the subset the organization has historically recruited from – a distinction that matters most for roles where diverse candidate representation is both a strategic priority and a supply-side constraint.
Common Challenges and Solutions
| Challenge | Solution |
|---|---|
| Survey data does not reflect the organization’s specific talent market (size, sector, geography) | Use at least three survey sources; weight surveys by relevance to your talent market segment; supplement with real-time offer data from your ATS |
| Compensation bands become outdated between annual review cycles | Implement quarterly benchmarking reviews for high-demand role families; build automatic review triggers into the compensation calendar at six-month intervals |
| Hiring managers override benchmarked pay ranges for preferred candidates | Require compensation band approval for any offer outside the benchmarked range; track exception volume and outcomes to measure the cost of non-benchmark offers |
| Internal equity disruption when new hires are offered above existing employee pay | Conduct an internal equity audit before implementing new benchmarks; budget for incumbent pay adjustments as part of the benchmarking cycle, not as an afterthought |
Real-World Case Studies
Case Study 1: The Technology Scale-Up
A 300-person technology company with a distributed workforce had been pricing engineering roles based on its headquarters city salary data. After implementing AI-powered compensation benchmarking that adjusted for the actual location distribution of its engineering talent pool, the company discovered it was underpaying 34% of its remote engineering roles relative to the relevant regional markets. The average pay gap was 14% below benchmark CCR.
After a structured compensation realignment conducted over two pay cycles, the engineering team’s voluntary turnover fell from 24% to 16% over twelve months – a reduction of eight departure events, each carrying an estimated replacement cost of $45,000. The total retention saving from the benchmarking-driven realignment was $360,000 against a benchmarking and realignment investment of approximately $40,000.
Case Study 2: The Financial Services Firm
A mid-market financial services firm with consistently high offer rejection rates for senior analyst roles commissioned a benchmarking review after discovering that 40% of Director-level offers were being declined, with compensation cited by candidates in post-offer feedback. The benchmarking analysis revealed the firm’s Director-level compensation was positioned at the 32nd percentile of market for its sector and location – a position it had held for three years while the market moved upward.
Following a compensation repositioning to the 50th percentile, offer acceptance rates improved from 60% to 87% within two hiring cycles. The time-to-fill reduction from fewer re-sourcing cycles saved approximately 18 hiring days per role across 14 senior roles in the following year.
Case Study 3: The Healthcare Network
A regional healthcare network used compensation benchmarking to resolve a persistent nursing recruitment challenge. The organization had attributed high vacancy rates to supply constraints in the nursing labor market – a partially accurate but incomplete diagnosis. A benchmarking analysis revealed that base nursing compensation was 11% below the market median for its metropolitan area, while three competitor health systems in the same geography were positioned at 100-108% of market.
After adjusting nursing base pay to the 50th percentile and adding referral bonuses for hard-to-fill specialties, the network’s vacancy rate for registered nurses fell from 18% to 9% over two quarters. The investment was recovered within four months through reduced agency staffing costs alone.
Building a Salary Benchmarking Tracking System: What to Measure?
Salary Benchmarking Across the Hiring Lifecycle
Pre-Hire: Role Pricing and Sourcing Strategy
Effective salary benchmarking begins before a role is posted. The benchmarking review for a new or backfill role should be completed before the job description is finalized – ideally before the requisition is opened – because the compensation range directly determines which candidate segments are reachable. A role priced at the 30th percentile will not attract candidates from the top half of the available talent market, regardless of how compelling the job description or employer brand is. Building compensation benchmarking into the data-driven recruiting process, rather than the offer approval process, moves the analysis to the point where it can actually affect sourcing strategy and candidate targeting.
Offer Stage: Real-Time Competitive Calibration
The offer stage is where salary benchmarking has its most direct and measurable impact on recruiting outcomes. Organizations that enter offer conversations with current, role-specific benchmark data – and use that data to construct offers at or above the candidate’s likely market reference point – consistently achieve higher offer acceptance rates than those operating on stale data or internal intuition.
For organizations making job offers to passive candidates who may have other live processes, the speed and accuracy of a well-benchmarked offer is frequently the deciding factor in candidate acceptance.
Post-Hire: Internal Equity and New Hire Integration
The hire is not the end of the benchmarking cycle. When a new hire is onboarded at a salary that reflects current market rates, the organization must reconcile that new rate with the existing team’s compensation – particularly for tenured employees whose pay has been growing through annual review increments that may not have kept pace with market movement. Internal equity audits triggered by new hire compensation are a best practice that salary benchmarking programs should build into their standard cadence, preventing the new hire from becoming an involuntary signal to existing employees about their own pay disadvantage.
Retention: Proactive Pay Review Triggers
The most common timing for a pay conversation between an employee and their manager is the moment the employee has received an external offer. At that point, a retention counter-offer is typically 15-20% more expensive than a proactive adjustment would have been six months earlier, and the employee’s commitment has already been partially disrupted by the job search process. Proactive compensation reviews triggered by benchmarking signals – a CCR that has drifted below threshold for a role, a tenure milestone, or a material market rate increase in a specific function – convert salary benchmarking from a reactive cost into a preventive retention investment.
The Real Cost of Ignoring Salary Benchmarking
| Scenario | Benchmarking Frequency | Offer Rejection Rate | Annual Talent Acquisition Cost (40 hires/yr) |
|---|---|---|---|
| No benchmarking | Never | 38% | $342,000 |
| Annual benchmarking | Once per year | 25% | $247,000 |
| Quarterly benchmarking | Four times per year | 14% | $168,000 |
| AI-assisted continuous benchmarking | Continuous | 8% | $124,000 |
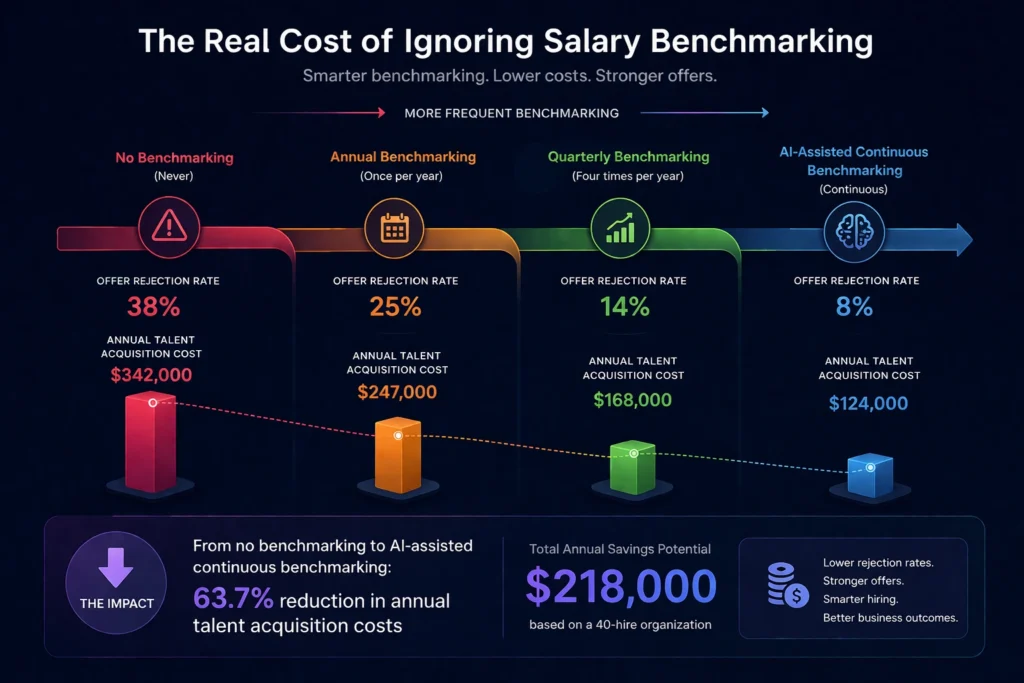
Cost model assumes average cost-per-hire of $4,800, vacancy productivity cost of $300/day, and average 22 days of additional time-to-fill per rejected offer requiring re-sourcing.
Related Terms
| Term | Definition |
|---|---|
| Pay Equity | The principle and practice of ensuring employees are compensated fairly relative to peers in equivalent roles, with analysis by demographic group |
| Compensation Band | A defined salary range for a specific job grade or level, typically derived from benchmarking data |
| Market Median | The midpoint of compensation for a defined role within a defined talent market, as measured by survey data |
| Total Rewards | The complete package of compensation, benefits, equity, and non-monetary value offered to employees |
| Salary Survey | A structured data collection from organizations about their compensation practices for defined roles, used as a primary input to benchmarking |
Frequently Asked Questions
How often should salary benchmarking be conducted?
At a minimum, organizations should conduct a comprehensive salary benchmarking review annually. For high-demand role families in technology, data, and product management, quarterly reviews are best practice in 2026, given the pace of market rate movement in these talent segments. Organizations that review only annually for competitive roles are typically operating on benchmarks that are already 6 to 8 months stale by the time hiring activity peaks.
What data sources are most reliable for salary benchmarking?
Credible benchmarking draws from a combination of established compensation surveys such as those from WorldatWork, Radford/Aon, and Willis Towers Watson, government wage data from the Bureau of Labor Statistics, and job market platforms with verified salary data. The organization’s own offer acceptance and declination records are also a high-signal source of real market data. No single source is sufficient; triangulating across at least three inputs produces the most defensible benchmarks.
How does salary benchmarking differ from pay equity analysis?
Salary benchmarking compares the organization’s pay to the external market. Pay equity analysis compares pay within the organization, typically by demographic group, to identify internal disparities. Both are necessary and address different questions with different data. An organization can pass a pay equity audit and still be 20% below market, or vice versa.
Can small organizations afford salary benchmarking?
Yes. Organizations with fewer than 200 employees can access credible benchmarking data through subscription-based platforms, industry association surveys, and government wage data at relatively low cost. The cost-per-hire impact of a single compensation-driven offer rejection typically exceeds the annual cost of a basic benchmarking subscription, making the ROI case straightforward even at small scale.
What market percentile should an organization target?
There is no universal answer. The target market position should reflect the organization’s talent strategy and competitive context. Companies competing for scarce, high-impact talent typically position at or above the 75th percentile for those roles. Companies in stable talent markets with strong non-monetary value propositions may be competitive at the 50th percentile. Benchmarking defines where the organization currently sits; pay positioning strategy defines where it should be, and why.
Conclusion
Salary benchmarking is not a compliance exercise or an annual HR administrative task. It is one of the most direct levers a talent acquisition function has to improve candidate attraction, offer acceptance rates, and workforce retention simultaneously.
Organizations that treat it as a continuous, data-informed process integrated into recruiting workflow – rather than an annual audit conducted after offer rejections have already accumulated – consistently outperform those that discover their compensation gaps at the worst possible moment: in an offer conversation with a candidate they cannot afford to lose.
In a talent market where candidates are better informed about their own market value than at any point in hiring history, the organizations that match that information parity through rigorous, frequent salary benchmarking are the ones that win the candidates they actually want.