Every hire is a business decision. Not just operationally, but financially.
Yet recruitment is one of the few business functions where significant budget is spent without a clear, consistent framework for measuring what comes back.
Return on Investment in hiring is the metric that changes that, bringing the same financial accountability to talent acquisition that every other business function is expected to operate under.
ROI of hiring measures the value generated by a successful hire relative to the total cost invested in acquiring, onboarding, and developing that employee. It connects cost per hire and quality of hire data to actual business outcomes, turning recruitment from a cost centre narrative into a value creation story that HR teams can present with confidence.
For teams running data-driven recruiting functions, ROI of hiring sits alongside people analytics as one of the most strategically significant metrics available. It reveals which sourcing channels, hiring processes, and recruitment funnel strategies are actually delivering value and which are consuming budget without producing proportional returns.
Strong predictive analytics infrastructure is what makes ROI of hiring measurable in practice.
The core metric governing ROI of hiring effectiveness is the Hiring ROI Rate: the ratio of value generated by a hire to the total cost of that hire, expressed as a percentage.
Hiring ROI Rate (%) = ((Value Generated by Hire - Total Cost of Hire) / Total Cost of Hire) x 100
Organizations with mature ROI of hiring measurement frameworks report Hiring ROI Rates of 150-400% for high-performing placements in revenue-generating roles. Industry average across all role types is significantly lower – and in organizations without structured ROI measurement, it is effectively unmeasured and therefore unmanaged.
What is Return on Investment (ROI) of Hiring?
Return on Investment (ROI) of hiring is a quantitative framework that measures the economic return generated by a recruitment investment – encompassing all costs incurred to identify, attract, assess, hire, and integrate a new employee – against the measurable value that employee delivers to the organization over a defined period, typically the first twelve to twenty-four months of tenure.
The ROI of hiring framework is distinct from standard recruitment metrics in one critical respect: it is outcome-oriented, not process-oriented. Cost-per-hire measures what you spent to fill a role. Time-to-fill measures how quickly you filled it. ROI of hiring measures whether the hire was worth making in the first place. These are fundamentally different questions, and only the third one tells you whether your talent acquisition function is creating or destroying organizational value.
At its most rigorous, the ROI of hiring calculation requires two inputs: the total cost of hire and the total value generated. Total cost of hire includes recruiter time, sourcing and advertising spend, assessment tools, interviewer hours, offer management, onboarding program costs, and the productivity ramp period during which a new hire is not yet performing at full capacity. Total value generated includes direct output contributions, revenue attributable to the hire, cost savings delivered, and the avoided cost of vacancy for the period the role was unfilled. Organizations that measure both sides of this equation consistently make better hiring investment decisions than those measuring only the cost.
Why ROI of Hiring Is the Most Undervalued Metric in Modern Talent Strategy?
The question surfaces in every TA leadership forum: why, if ROI of hiring is so important, do so few organizations actually measure it? The honest answer is a combination of data fragmentation, organizational politics, and the uncomfortable reality that measuring ROI of hiring means accepting accountability for outcomes, not just activities. Recruiters are typically measured on process metrics they can influence directly. Hire performance, twelve months after the offer is signed, is not something most recruiting functions are structured to track, own, or report on.
The cost of this measurement gap is staggering. The US Department of Labor estimates that the cost of a bad hire is approximately 30% of that employee’s first-year salary. For a $100,000-per-year role, that is $30,000 in direct costs – severance, replacement recruiting, productivity loss, and team disruption. For a VP-level role at $250,000 base, the cost of a bad hire approaches $75,000 to $150,000 when indirect costs are included. Organizations making twenty hires per year with a 15% bad hire rate are absorbing $300,000 to $600,000 annually in avoidable recruitment waste – waste that is entirely invisible on the standard talent acquisition dashboard.
The ROI math becomes even more compelling when you move beyond the bad hire scenario to the good hire opportunity cost. Research on performance differentiation in knowledge work found that in complex roles, top performers produce 400% more output than average performers. For a software engineering role with a $150,000 base salary, the difference between hiring a top performer and an average performer is worth an estimated $450,000 to $600,000 in annual output value – a differential that completely dwarfs any difference in recruitment cost between the two candidates.
The organization that hires the exceptional candidate via an expensive retained search at $45,000 in fees achieves a dramatically higher ROI of hiring than the one that saves the fee and hires an average candidate through a cheaper internal process.
The practical implication for talent acquisition leaders is clear: the ROI of hiring conversation is the most important conversation you are probably not having with your CFO. The organization that walks into a budget review with data showing that its talent acquisition function generated $8.4 million in hire value against $2.1 million in total recruitment investment – a 400% ROI of hiring – is in a fundamentally different negotiating position than one presenting only process efficiency metrics. ROI of hiring converts the recruiting function from a cost center to a value generator in the language finance leadership actually speaks.
A concrete data point: LinkedIn Talent Solutions research found that organizations that formally measure quality of hire – the closest widely-used proxy for ROI of hiring – report 33% lower regrettable attrition rate, 25% faster time-to-productivity for new hires, and 19% higher new hire performance ratings at the twelve-month mark compared to organizations that do not measure quality of hire. These are not marginal improvements. They represent a systematic, measurable difference in talent investment returns driven entirely by the act of measurement and the behavioral changes it produces.
For TA leaders making the case internally, the ROI of hiring framework is the instrument that elevates the talent acquisition function from transactional service provider to strategic business partner. Build the measurement capability, present the results, and the conversation about recruiting investment changes permanently.
Your Resume Isn’t Getting Read
Let’s Get That Fixed!
75% of resumes get auto-rejected. avua’s AI Resume Builder optimizes formatting, keywords, and scoring in under 3 minutes, so you land in the “yes” pile.
The Psychology Behind ROI of Hiring Decisions
Sunk Cost Fallacy in Recruitment Spending
One of the most persistent behavioral traps in ROI of hiring decisions is the sunk cost fallacy: the tendency to continue investing in a recruitment process or a marginal candidate because significant resources have already been spent, rather than making a fresh evaluation of expected return. A hiring manager who has invested six weeks in a search and interviewed twelve candidates experiences psychological pressure to make an offer to the best candidate in that pool – even when the best candidate is objectively not strong enough for the role.
Recognizing sunk cost dynamics as a ROI risk – and building explicit decision checkpoints that force a fresh ROI evaluation rather than a relative comparison – is one of the highest-value behavioral interventions available to TA leaders.
Short-Termism and Budget Cycle Pressure
ROI of hiring is inherently a long-duration metric – the return on a hire is realized over months and years, while the cost is incurred in weeks. This temporal mismatch creates systematic distortion in hiring decision-making. Budget cycles that measure recruitment cost against quarterly targets create pressure to minimize short-term spend even when higher upfront investment would generate substantially greater long-term returns.
A retained executive search that costs $80,000 and places a CFO who drives $2 million in efficiency improvements in year one is a 2,400% ROI event – but the $80,000 cost appears on the Q2 budget while the $2 million value appears on the year-end P&L, and different people are accountable for each. Aligning budget accountability across recruitment cost and hire value is the structural fix for short-termism in hiring investment decisions.
Attribution Complexity and Measurement Avoidance
Many organizations avoid measuring ROI of hiring not because they lack interest in the outcome, but because attributing performance outcomes to individual hiring decisions is genuinely complex. An employee’s productivity is shaped by their manager, their team, their tools, their onboarding quality, and market conditions – not only by the quality of the original hire. This attribution complexity is real, but it is not a justification for avoiding measurement entirely. Proxy metrics – performance ratings at twelve months, retention at eighteen months, speed to full productivity, manager satisfaction scores – provide sufficient signal to assess hiring ROI directionally, even where perfect attribution is impossible.
ROI of Hiring vs. Related Talent Metrics
| Metric | What It Measures | Time Horizon | ROI Relevance |
|---|---|---|---|
| ROI of Hiring | Economic return on total recruitment investment | 12-24 months post-hire | Direct ROI measure |
| Cost-per-Hire | Recruitment spend per filled role | Point-in-time | Cost side of ROI only |
| Time-to-Fill | Days from req open to offer acceptance | Point-in-time | Indirect (vacancy cost) |
| Quality of Hire | Performance of hire relative to expectations | 12 months post-hire | Closest proxy for ROI |
| Offer Acceptance Rate | Proportion of offers accepted | Point-in-time | Process efficiency, not ROI |
| Attrition Rate | Proportion of hires who leave voluntarily | 12-24 months | ROI risk indicator |
| First-Year Retention | Proportion of hires retained at 12 months | 12 months | Long-term ROI multiplier |
The critical distinction in the table above is between metrics that measure the cost side of ROI of hiring (cost-per-hire, time-to-fill) and those that measure the value side (quality of hire, performance ratings). Most talent acquisition functions measure the cost side comprehensively and the value side rarely – which means their ROI of hiring picture is always incomplete and systematically biased toward underinvestment in quality.
What the Experts Say?
The companies that win the talent game over the long term are the ones that treat every hire as a capital allocation decision. They ask not just ‘can we afford this candidate?’ but ‘what is the expected return on this hire relative to alternatives?’ That question changes every part of how you recruit.
– Peter Cappelli, Professor of Management, Wharton School of Business; Author of Why Good People Can’t Get Jobs
How to Measure ROI of Hiring?
Formulas
Hiring ROI Rate (%) = ((Value Generated by Hire - Total Cost of Hire) / Total Cost of Hire) x 100
Total Cost of Hire = Recruiter Time + Sourcing Spend + Assessment Costs + Interviewer Hours + Onboarding Cost + Productivity Ramp Cost
Value Generated by Hire = Direct Output Value + Revenue Attribution + Cost Savings Delivered + Avoided Vacancy Cost
Quality of Hire Score = (Performance Rating at 12 Months / Org Average Performance Rating) x 100
Hiring ROI Payback Period (months) = Total Cost of Hire / Monthly Value Generated by Hire
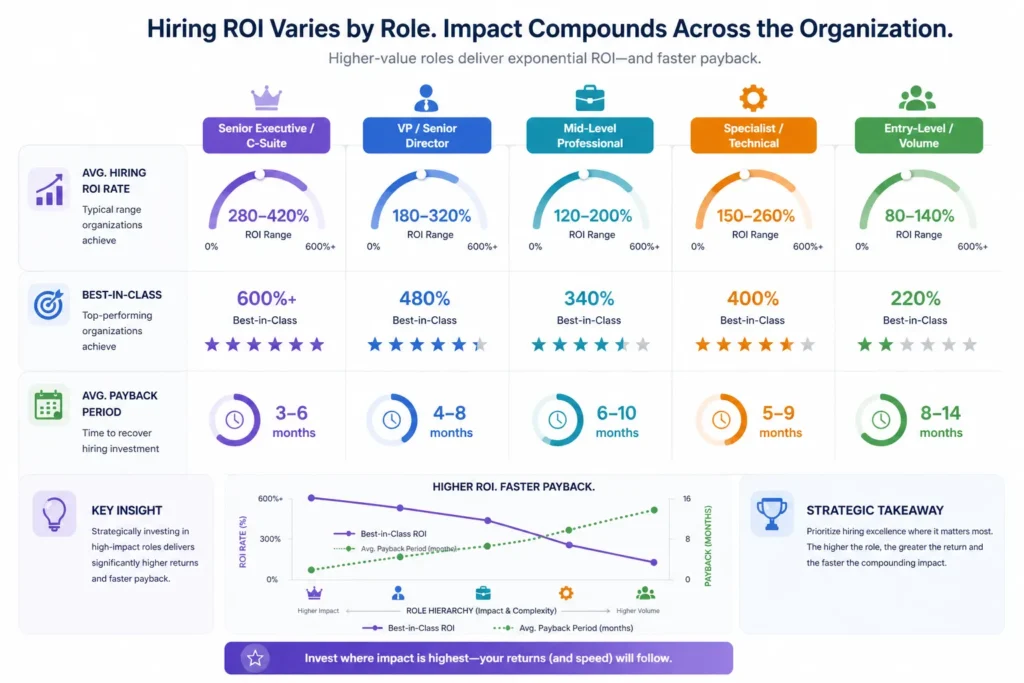
Benchmarks by Role Type
| Role Category | Avg. Hiring ROI Rate | Best-in-Class | Avg. Payback Period |
|---|---|---|---|
| Senior Executive / C-Suite | 280-420% | 600%+ | 3-6 months |
| VP / Senior Director | 180-320% | 480% | 4-8 months |
| Mid-Level Professional | 120-200% | 340% | 6-10 months |
| Specialist / Technical | 150-260% | 400% | 5-9 months |
| Entry-Level / Volume | 80-140% | 220% | 8-14 months |
Key Strategies for Maximizing ROI of Hiring
How Can AI and Automation Improve ROI of Hiring?
Predictive Quality-of-Hire Modeling
AI-powered talent platforms can analyze the attributes of past high-ROI hires – skill profiles, career trajectory, assessment scores, cultural fit signals – and build predictive models that identify which candidates are statistically most likely to generate high ROI of hiring in specific roles. This moves candidate selection from intuition-driven assessment toward data-informed prediction, improving quality-of-hire rates at scale without proportional increases in recruiter time or cost.
Automated Cost Tracking and ROI Attribution
AI-powered ATS and HRIS integrations can automatically capture and aggregate the cost inputs required for ROI of hiring calculations – recruiter time logs, sourcing spend by channel, assessment tool costs, and interviewer hours – eliminating the manual data collection that makes ROI measurement impractical for most recruiting teams. When cost data is automatically captured and performance data is pulled from the HRIS at twelve months, ROI of hiring becomes a reportable metric rather than a quarterly research project.
AI-Assisted Candidate Screening
AI screening tools raise the quality floor of candidates entering the evaluation process, which is the primary lever for improving ROI of hiring at scale. By ensuring that only candidates meeting objective quality thresholds reach the interviewing stage, AI screening tools reduce the evaluation time wasted on underqualified candidates and increase the proportion of interview time spent on genuinely high-potential shortlists. Higher shortlist quality produces higher offer quality, which produces higher hire quality, which produces higher ROI of hiring – the entire value chain improves.
Real-Time ROI Dashboards and Market Intelligence
HR analytics platforms powered by AI can maintain live ROI of hiring dashboards that update as performance data flows in from the HRIS – giving TA leaders real-time visibility into hire quality trends, ROI by source channel, and the compounding performance of the overall talent investment portfolio. This real-time visibility enables proactive intervention when ROI of hiring trends deteriorate, rather than the post-mortem analysis that characterizes most current approaches to quality-of-hire management.
Stop Juggling
10 Job Boards.
Search One
Your next role is already here. avua pulls opportunities from across the web into a single searchable feed; filtered by role, location, salary, and remote preference.
1.5 Million+
Active Jobs
380+
Job Categories
ROI of Hiring and Long-Term Organizational Resilience
ROI of hiring is not solely a financial metric – it is an organizational resilience indicator. Organizations that consistently generate high returns on their hiring investments are building durable human capital advantages: teams with the right skills, leaders with the right judgment, and cultures with the right density of high performers. These advantages compound over time and are extraordinarily difficult for competitors to replicate quickly.
The connection between ROI of hiring and employee retention is particularly important for long-term organizational resilience. High-ROI hires – individuals who were well-matched to their roles through rigorous selection processes – consistently show higher engagement, longer tenure, and lower voluntary attrition than average hires. Research indicates that organizations with strong hiring and onboarding processes improve new hire retention by 82% compared to those without structured processes. This retention differential is the mechanism through which ROI of hiring compounds: every year a high-ROI hire remains in the organization, the cumulative return on the original investment grows while the cost basis remains fixed.
The equity dimension of ROI of hiring deserves specific attention in resilience planning. Organizations measuring ROI of hiring rigorously sometimes discover that their highest-ROI hires come disproportionately from candidate pools they have historically underinvested in – non-traditional educational backgrounds, alternative career pathways, or underrepresented demographic groups who were rarely prioritized in conventional sourcing strategies. When ROI measurement surfaces these patterns, it provides a financially grounded case for broadening sourcing investment that complements the ethical and DEI arguments – and in many organizations, the financial argument is the one that actually changes behavior at the sourcing budget level.
Building resilience through ROI of hiring also requires attention to the concentration risk in talent portfolios. Organizations that consistently hire from a narrow set of competitor firms, educational institutions, or geographic markets are systematically building homogeneous teams – which research consistently links to lower innovation output and higher groupthink risk. ROI of hiring frameworks that include diversity of perspective as a value metric alongside performance ratings provide the measurement infrastructure for managing this concentration risk explicitly and proactively.
Common Challenges and Solutions
| Challenge | Solution |
|---|---|
| No access to post-hire performance data for ROI of hiring calculation | Partner with the HRIS team to establish a twelve-month performance data feed to the TA function; start with the data available and build measurement maturity progressively |
| Disagreement on how to assign a monetary value to a hire’s contribution | Agree on proxy metrics (performance rating, manager satisfaction, revenue attribution where available) before the search begins; document the agreed methodology so it cannot be disputed after the fact |
| ROI measurement creates anxiety among recruiters about being judged on outcomes they do not control | Frame ROI of hiring measurement as a team-level insight tool and portfolio metric, not an individual recruiter performance evaluation; emphasize learning over accountability in early implementation phases |
| Finance does not recognize the value side of hiring ROI | Build a shared cost-of-vacancy and cost-of-bad-hire model that finance validates; use that agreed model as the ROI value denominator in all subsequent reporting |
| ROI of hiring data exists but is not presented in a format that influences decisions | Create a quarterly ROI of hiring summary in CFO-facing language – total recruitment investment, total hire value generated, ROI rate – and present it in the same forum as other capital allocation discussions |
Real-World Case Studies
Case Study 1: The Technology Scale-Up
A 300-person SaaS company had been measuring recruitment performance exclusively through cost-per-hire and time-to-fill for three years. When the CEO pushed back on a request to double the recruitment budget, the TA leader built a retrospective ROI of hiring analysis covering the previous eighteen months of hires. The analysis found that the top quartile of hires by performance rating had generated an average of 3.8x the value of total recruitment investment in their first year, while the bottom quartile had generated 0.6x – a six-fold ROI of hiring difference between best and worst hires.
The analysis also showed that the highest-ROI hires had come disproportionately from the firm’s retained search channel, not from the lower-cost job board channel that had produced the highest volume. The budget was approved, reallocated toward higher-quality sourcing channels, and twelve-month ROI of hiring improved from an estimated 140% to 290% over two hiring cycles.
Case Study 2: The Financial Services Firm
A regional bank conducting a head of risk search had budgeted $35,000 for the search using a contingency recruiter. After eight weeks without a compelling shortlist, they engaged a retained search firm at $65,000. The retained process produced a shortlist in nineteen days; the placed candidate was not on any job board and had not been in active conversation with any other firm.
At the twelve-month mark, the placed candidate had redesigned the bank’s risk framework, avoiding an estimated $1.2 million in regulatory exposure. The ROI of hiring on the $65,000 search investment was 1,746%. The bank now uses retained search as its default approach for all director-level and above roles, with an explicit ROI of hiring target embedded in every retained brief.
Case Study 3: The Healthcare Network
A regional healthcare system implemented a formal ROI of hiring measurement framework across all nursing and allied health hiring, tracking performance ratings, retention outcomes, and patient satisfaction attribution at the twelve-month mark. The analysis revealed that candidates sourced through its employee referral program had ROI of hiring rates 67% higher than candidates sourced through job boards, driven primarily by lower attrition (14% vs. 34% at twelve months) and faster ramp to full productivity (11 weeks vs. 19 weeks).
The healthcare system reallocated 30% of its sourcing budget from job board advertising to the employee referral program, offering a $2,500 referral bonus. In the following cycle, average ROI of hiring across nursing roles improved from 160% to 247%, and the referral program produced 44% of all nursing hires.
Building a ROI of Hiring Performance Scorecard: What to Measure?
ROI of Hiring Across the Talent Lifecycle
Pre-Hire: Investment Calibration Against Expected Return
ROI of hiring begins before the search brief is written. The highest-leverage ROI decision is the one made before sourcing starts: how much should be invested in this search relative to the expected return? A $50,000 first-year salary role generating $150,000 in annual value cannot justify a $45,000 retained search fee. A $400,000 first-year salary executive role generating $3 million in value absolutely can. Building an expected-ROI model for each role – based on its salary, value generation potential, and strategic importance – provides the rational framework for sourcing budget allocation that most organizations currently lack entirely.
Selection: Quality as the Primary ROI Driver
The selection stage is where ROI of hiring is fundamentally determined. The tools, processes, and judgment applied at the evaluation stage determine whether the organization places a high-performing or average hire – and the performance differential between those two outcomes, compounded over years of tenure, is the primary source of ROI variance between organizations. Structured interviews, validated assessment tools, calibrated evaluation rubrics, and diverse interviewer panels consistently produce higher quality-of-hire scores than intuition-driven selection processes, and higher quality-of-hire is the direct input to higher ROI of hiring over any time horizon.
Onboarding: The Hidden ROI Multiplier
Onboarding quality is one of the most underappreciated ROI of hiring variables. A hire’s productivity ramp curve is shaped primarily by the quality of their onboarding experience: the clarity of their role expectations, the speed of their relationship-building, and the structured support they receive in their first 90 days. Research from the Society for Human Resource Management indicates that effective onboarding can improve new hire productivity by up to 70% and increase retention by over 80%.
For a hire with a total cost of $60,000 (including fees and ramp cost), a 70% productivity improvement in the first year represents tens of thousands of dollars in additional value generation – making onboarding investment one of the highest-return components of the overall ROI of hiring equation.
Retention: Where ROI of Hiring Is Won or Lost Over Time
The long-term ROI of hiring is ultimately determined by retention. A high-quality hire who leaves at eighteen months generates a fraction of the ROI of an equivalent hire who stays for five years, because the fixed cost of acquisition is amortized over a much shorter value generation period. Organizations with strong employee retention outcomes consistently report higher lifetime ROI of hiring than those with high voluntary attrition – because retention multiplies the return on every successful placement.
For TA leaders, retention investment is recruiting ROI investment: every dollar spent on manager quality, culture, compensation competitiveness, and career development that improves retention directly improves the ROI of hiring figures the TA function can report.
The Real Cost of Ignoring ROI of Hiring
| Scenario | Measurement Approach | Bad Hire Rate | Est. Annual ROI Loss (30 hires/year) |
|---|---|---|---|
| No ROI measurement | Intuition-driven hiring | 22-28% | $495,000 – $630,000 |
| Process metrics only | Cost and speed focused | 16-20% | $360,000 – $450,000 |
| Quality of hire tracking | Performance-informed | 10-14% | $225,000 – $315,000 |
| Full ROI of hiring framework | Investment-optimized | 5-8% | $112,500 – $180,000 |
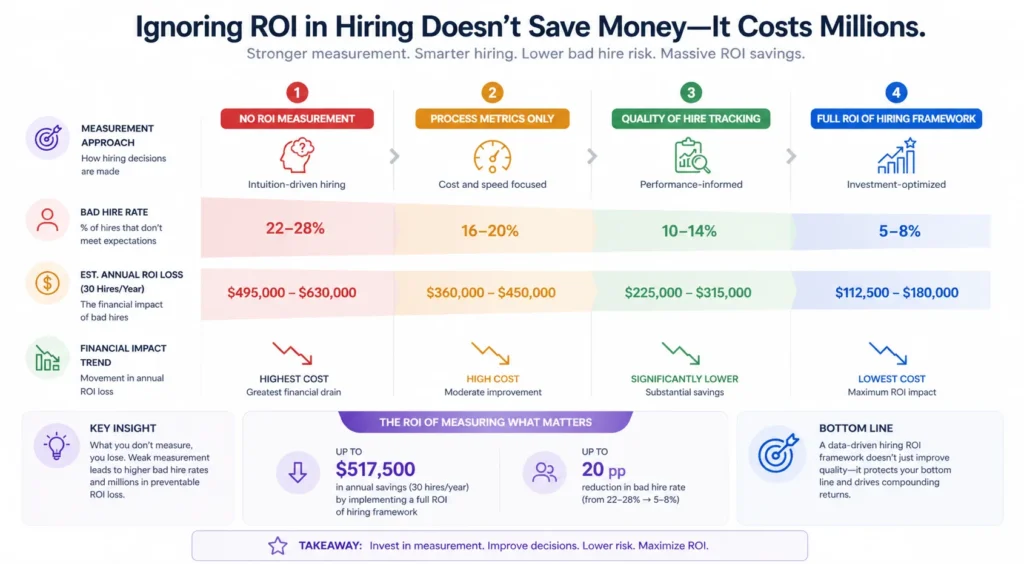
Bad hire cost assumed at $75,000 per instance (replacement cost + productivity loss) for mid-level professional roles. ROI loss represents the difference between actual outcome and achievable outcome with full ROI measurement and optimization.
Related Terms
| Term | Definition |
|---|---|
| Quality of Hire | A composite metric measuring the performance and value delivered by a new hire relative to organizational expectations; the most widely used proxy for ROI of hiring |
| Cost-per-Hire | The total direct and indirect cost of filling an open role, representing the cost input in the ROI of hiring calculation |
| HR Analytics | The practice of applying data analysis and statistical methods to human resources data to inform talent decisions, including ROI of hiring measurement |
| Productivity Ramp | The period between a new hire’s start date and the point at which they are performing at full expected capacity; a significant cost component in total cost of hire |
| Talent Pipeline | The pool of engaged candidates at various stages of the recruitment process; the quality of which is the primary upstream driver of ROI of hiring outcomes |
| Bad Hire | A placement that fails to meet performance expectations within the first twelve months, generating negative ROI on the hiring investment and triggering replacement costs |
| Offer Acceptance Rate | The proportion of offers extended that are accepted by candidates; a process efficiency metric that influences but does not directly determine ROI of hiring |
Frequently Asked Questions
How do you calculate the ROI of hiring?
The ROI of hiring calculation has two steps. First, calculate your total cost of hire by adding recruiter fees, sourcing spend, interviewer time, assessment costs, onboarding program costs, and the productivity ramp cost (typically estimated as the new hire’s daily salary rate multiplied by the number of days to full productivity). Second, estimate the value generated by the hire over the measurement period – using performance ratings, revenue attribution, cost savings, or a combination. Apply the formula: ROI of Hiring (%) = ((Value Generated – Total Cost) / Total Cost) x 100.
Why do most organizations not measure ROI of hiring?
Most organizations do not measure ROI of hiring for three reasons: data fragmentation (cost data lives in finance systems, performance data lives in HR systems, and the two are rarely connected), accountability ambiguity (recruiting teams are measured on process speed and cost, not hire outcomes), and the genuine complexity of attributing an employee’s performance to the hiring decision alone. AI-powered HR analytics platforms are increasingly solving the data fragmentation problem, making ROI of hiring measurement more feasible for organizations without dedicated People Analytics teams.
What is the cost of a bad hire?
The cost of a bad hire is typically estimated at 30% of first-year salary (US Department of Labor benchmark) for entry-to-mid-level roles, rising to 50-200% of first-year compensation for senior and executive roles when indirect costs are included. Indirect costs include productivity loss during the underperformance period, manager time spent on performance management, team disruption and morale impact, replacement recruitment cost, and the extended vacancy cost while the role is re-sourced. For a $100,000 base salary role, total bad hire cost is typically $30,000-$50,000. For a $300,000 executive role, it can reach $150,000-$600,000.
How does ROI of hiring differ from cost-per-hire?
Cost-per-hire measures only the cost side of the hiring investment equation – the total spend required to fill a role. ROI of hiring measures both sides: cost and value. A low cost-per-hire achieved by cutting quality corners frequently produces a negative ROI of hiring outcome, while a high cost-per-hire justified by exceptional candidate quality often produces the highest ROI outcomes. Organizations optimizing purely for cost-per-hire will systematically underinvest in quality and overestimate their actual hiring performance.
Can small organizations measure ROI of hiring?
Yes, even without sophisticated analytics infrastructure. A small organization can begin measuring ROI of hiring by tracking two simple metrics: twelve-month retention rate by sourcing channel (calculable from any basic ATS), and manager satisfaction score at six months (requiring only a simple survey). These two proxies provide significant directional signal about ROI variance across sourcing channels and selection processes – enough to make meaningfully better hiring investment decisions without requiring a dedicated People Analytics capability.
What is a good ROI of hiring percentage?
A healthy ROI of hiring rate varies significantly by role type and seniority. For mid-level professional roles, an ROI of hiring rate of 150-250% in the first year is considered strong performance. For senior executive placements, ROI rates of 300-500% are achievable when the hire is well-matched to the role. Any hire generating an ROI below 100% – meaning the cost of hire exceeded the value generated – should trigger a root cause analysis of either selection quality or onboarding effectiveness.
Conclusion
ROI of hiring is not a complexity that organizations should defer until they have a perfect People Analytics team and flawless data infrastructure. It is the fundamental measurement framework that converts talent acquisition from a cost function into a value-generating investment discipline. The organizations treating every hire as a capital allocation decision – asking not just “how quickly and cheaply can we fill this role?” but “what is the expected and actual return on this hiring investment?” – are building durable competitive advantages in human capital that compound over years and decades.
The data, the frameworks, and the AI tools to make ROI of hiring measurement practical at any organizational scale exist today. The only remaining barrier is the decision to start measuring. Make that decision, and the conversation about what talent acquisition is worth to your organization changes permanently.